The experimental geometry was modeled based on the coordinates provided by Kalala (2008)[8]. After running the Rocky case as specified, the results can then be compared to the experimental values. This validation case demonstrate that such a modeling scheme still maintains reasonable accuracy in the geometry volume compared to experimental measurements, as we can see in Table 2.8: Comparison between the experimental and simulation geometry volume.
Table 2.8: Comparison between the experimental and simulation geometry volume.
| Geometry | Volume ( ) ) | Relative Error (%) |
|---|---|---|
| Unworn reference | 0.1131 | - |
| Worn Experimental | 0.0967 | - |
| Worn Rocky simulation | 0.0956 | -0.8 |
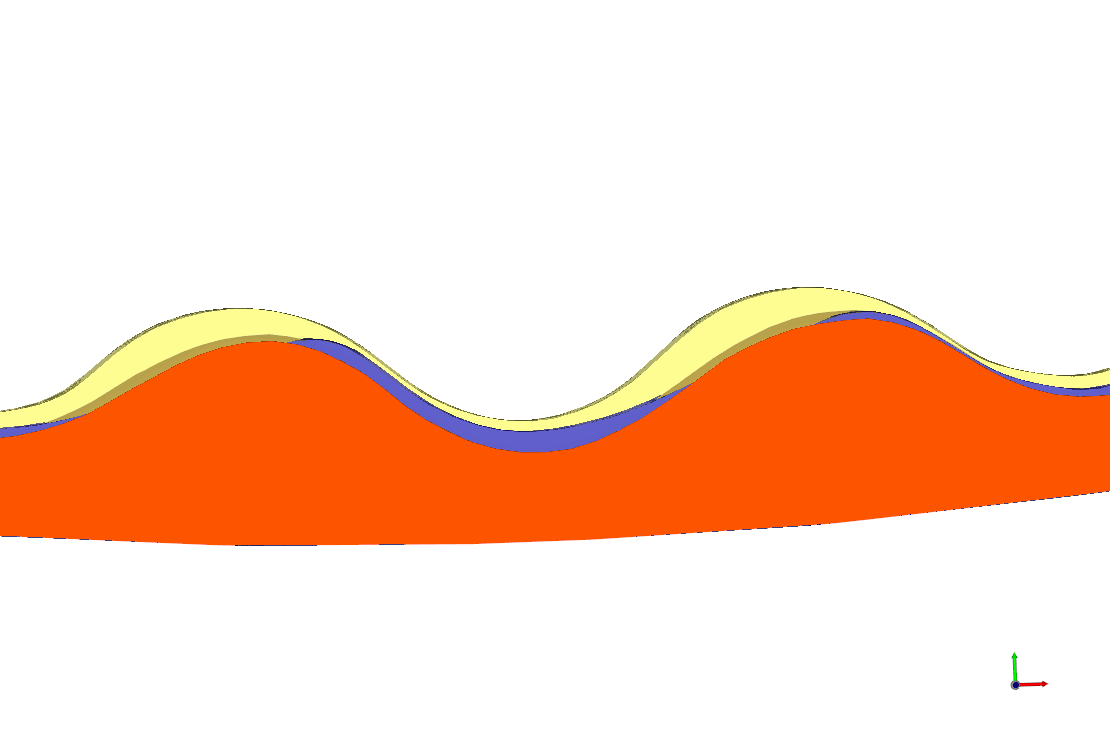
It is also possible to verify that the wear profiles between the experimental geometry and simulation are similar (Figure 2.14: Comparison between profiles: Unworn reference (Yellow), Worn Experimental (Purple) and Worn Rocky simulation (Orange). ).
Figure 2.14: Comparison between profiles: Unworn reference (Yellow), Worn Experimental (Purple) and Worn Rocky simulation (Orange).