


After running the Rocky case as specified, the results can then be compared to the analytical values. Here, the evolution of the inner sphere's (the particle's) temperature over time is shown in Figure 2.8: Comparison of temperature for the inner sphere and the analytical solution [K].. The numerical solution given by Rocky presents strongly correlated values to those obtained by the analytical expression.
![Comparison of temperature for the inner sphere and the analytical solution [K].](graphics/comparison_temperature.png)
The absolute and relative errors for the inner sphere's (the particle's) temperature are compared in Figure 2.9: Absolute and relative errors for the results shown in the previous image.. The maximum absolute error for the temperature is around 1.5 K. The maximum relative error is around 0.11% K.
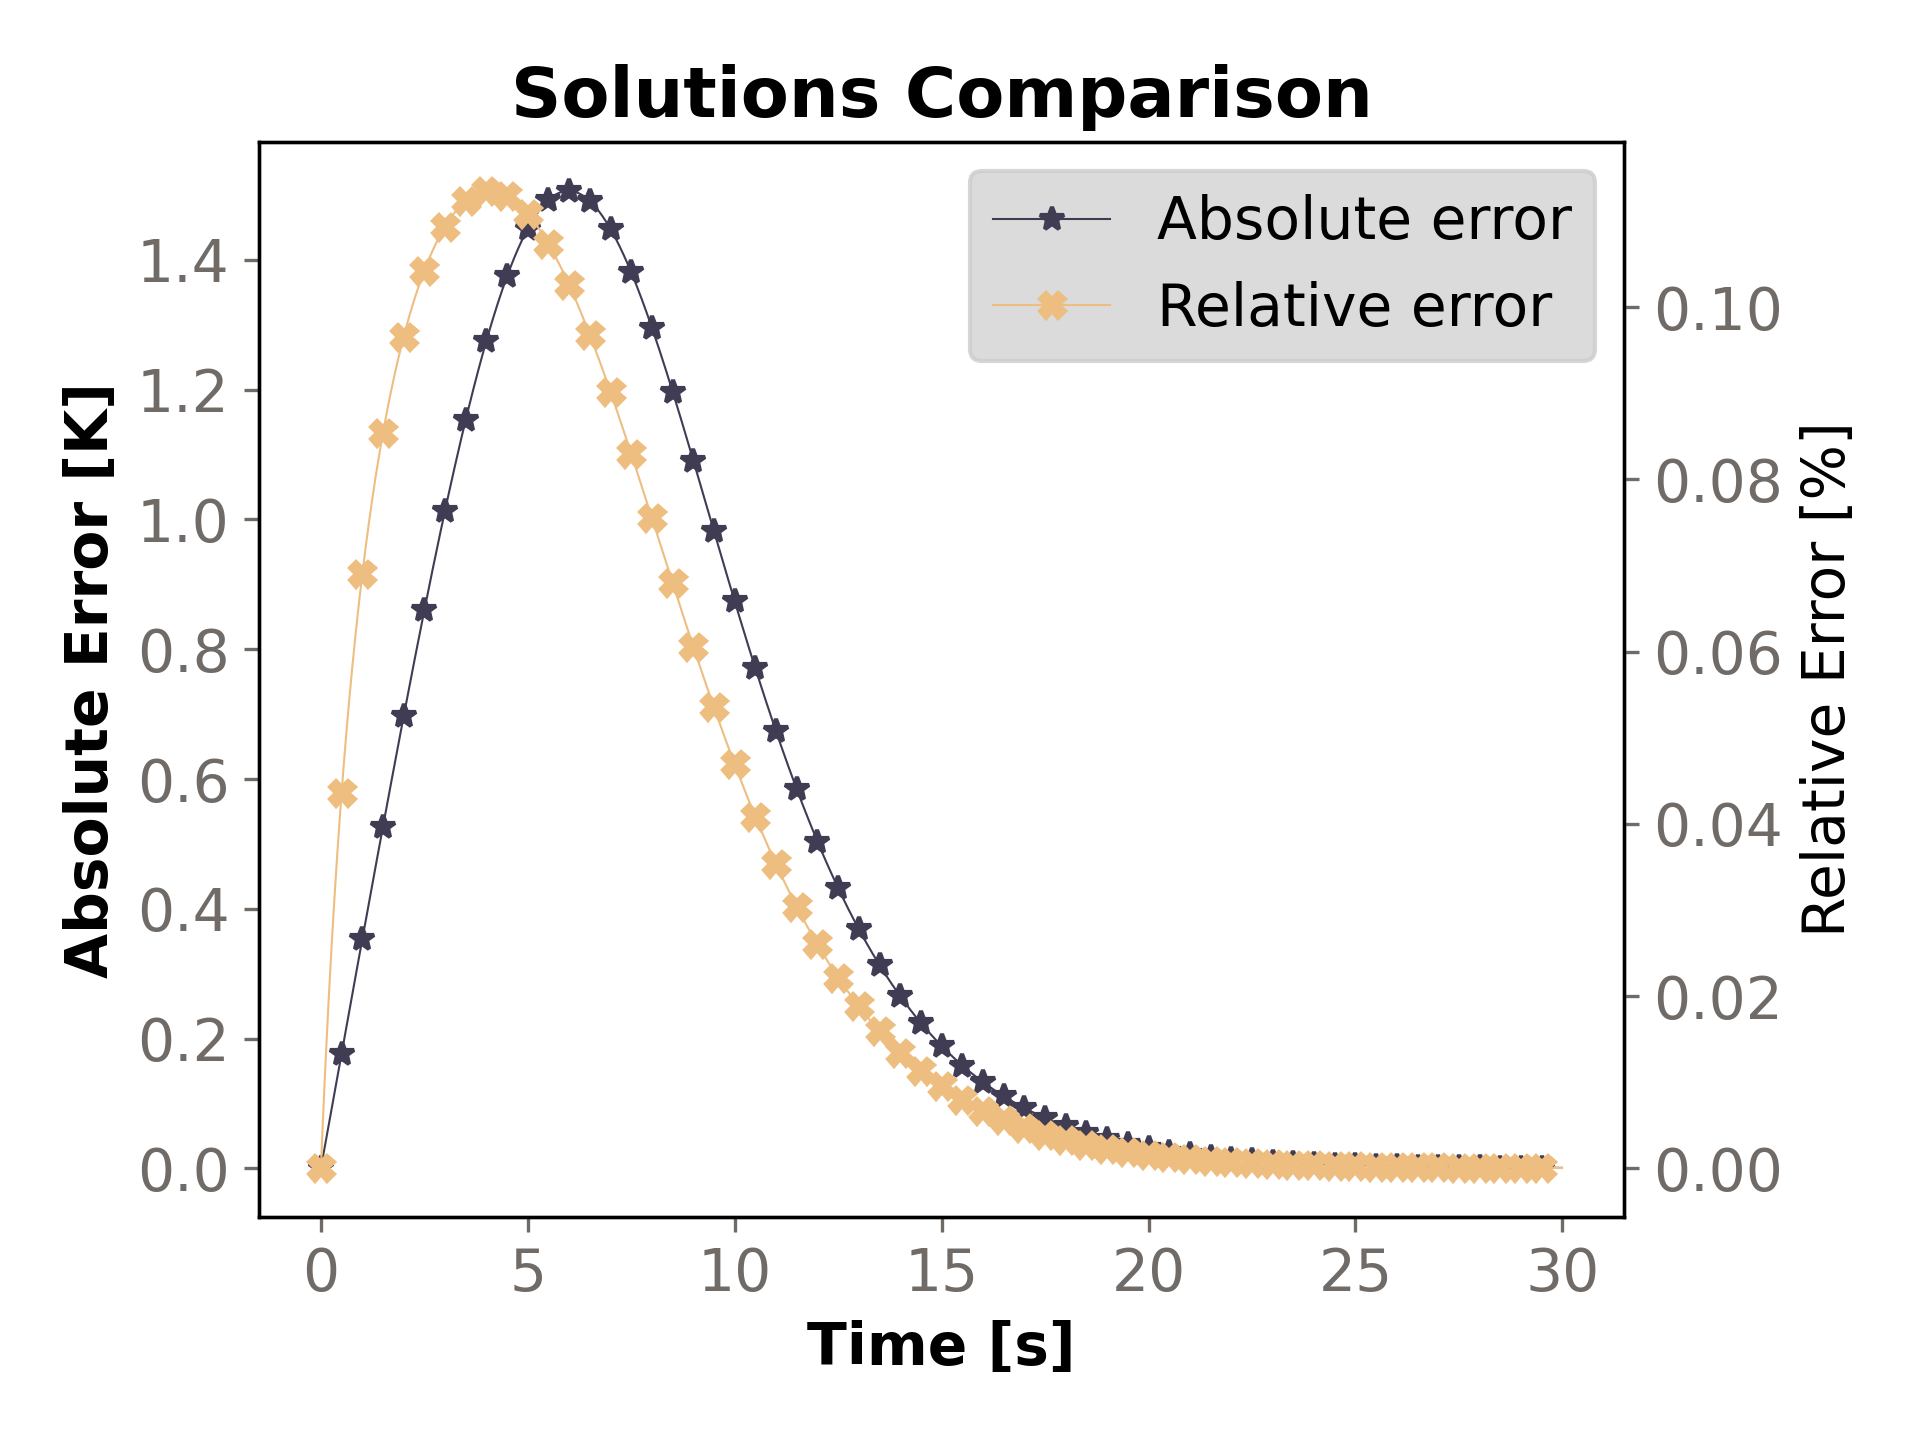
Table 2.5: Temperature target lists the value for the final temperature. This includes the target value calculated by the analytical expression as compared to the value calculated by Rocky. A Ratio of 1.0 here shows a strong correlation between the results.