


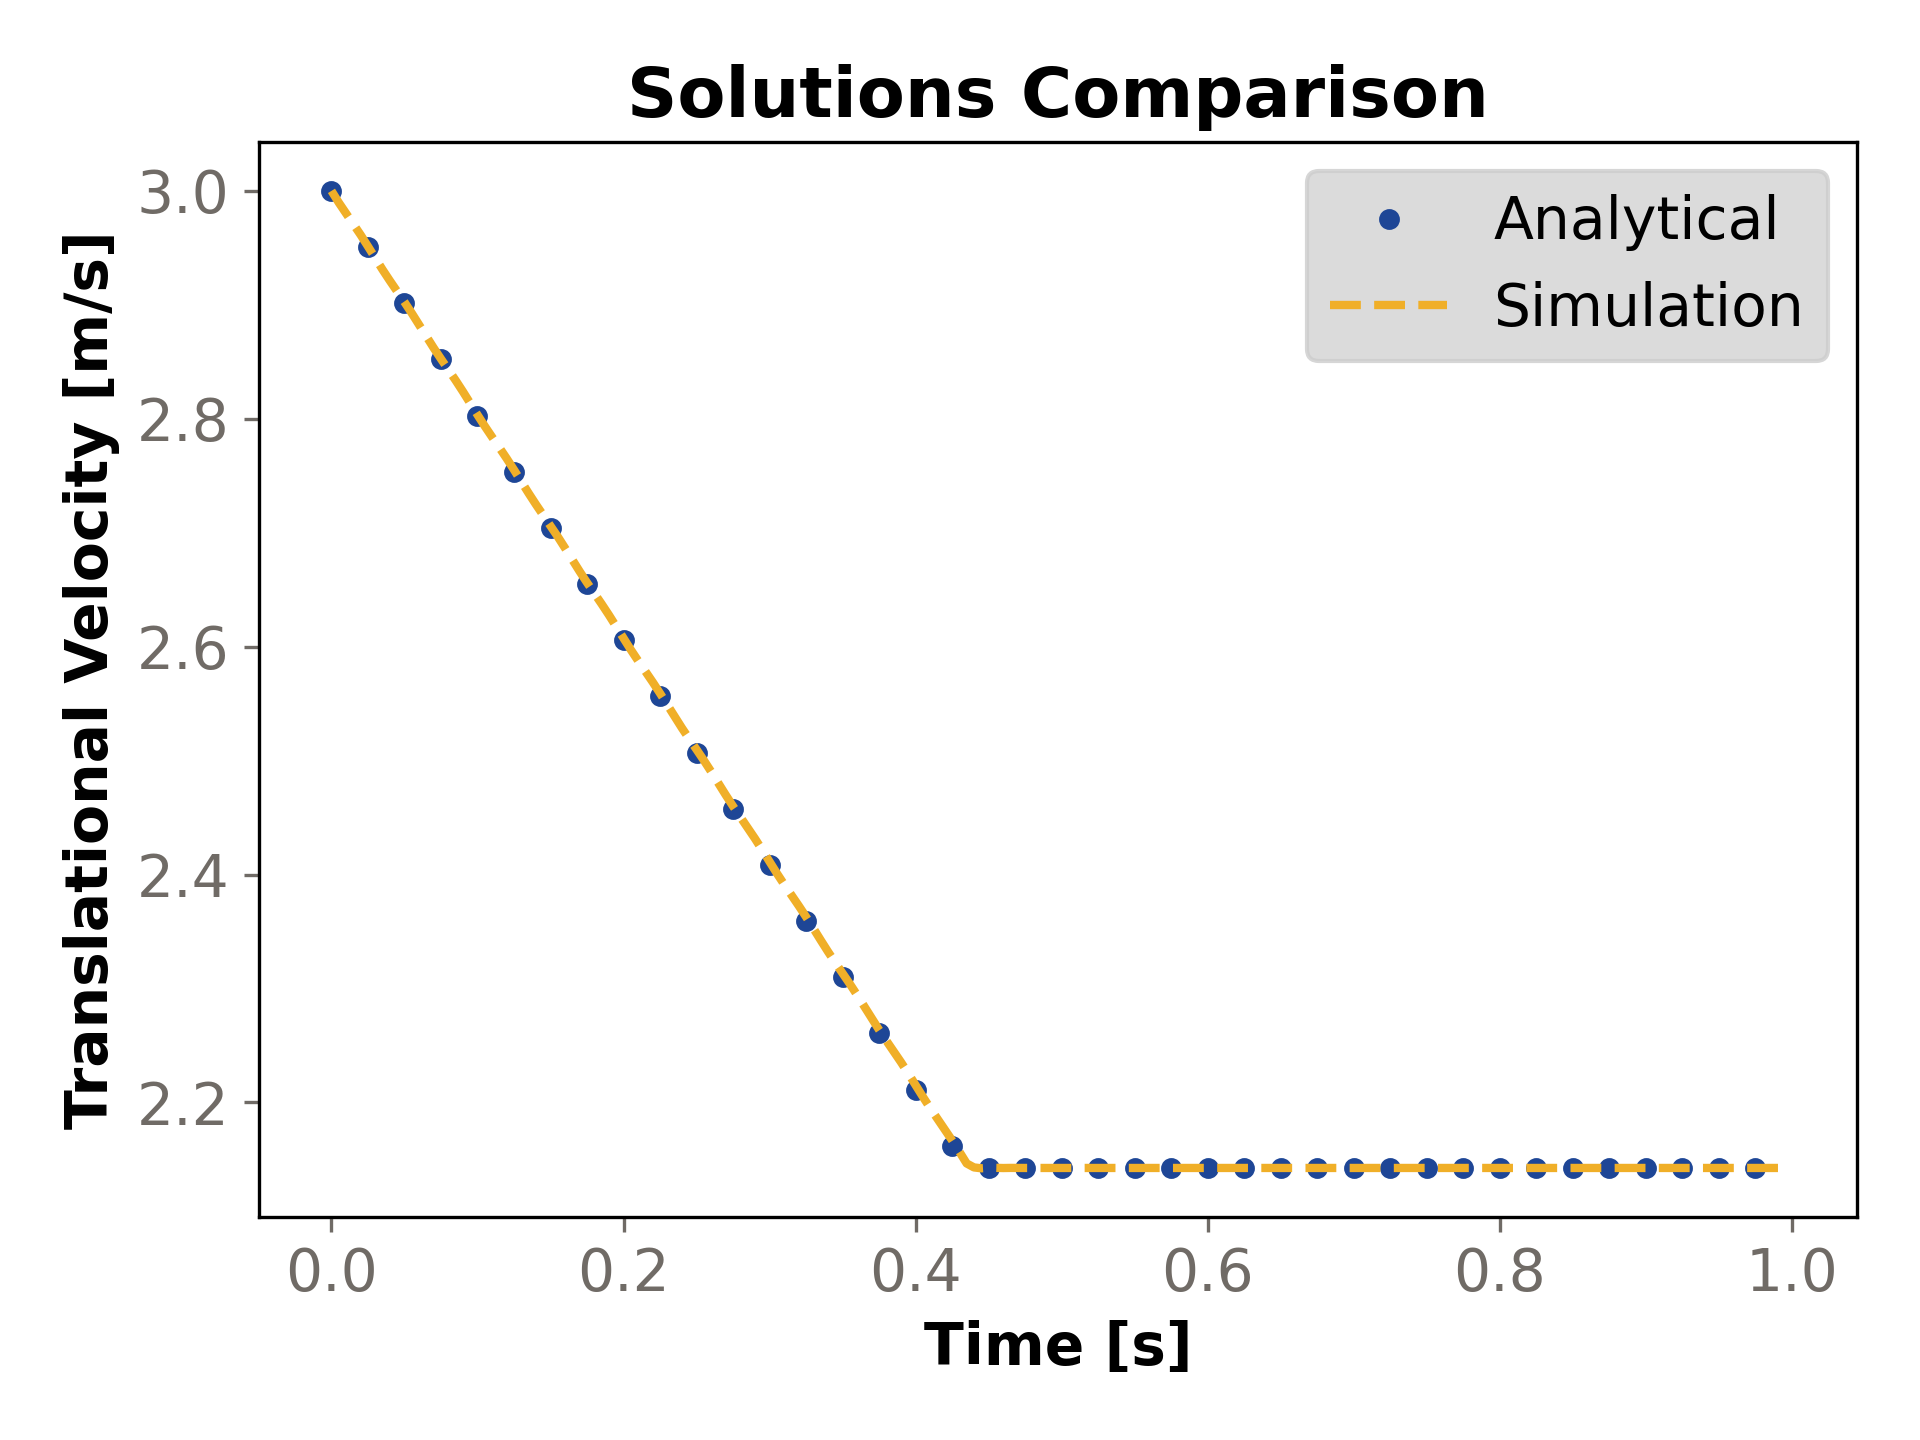
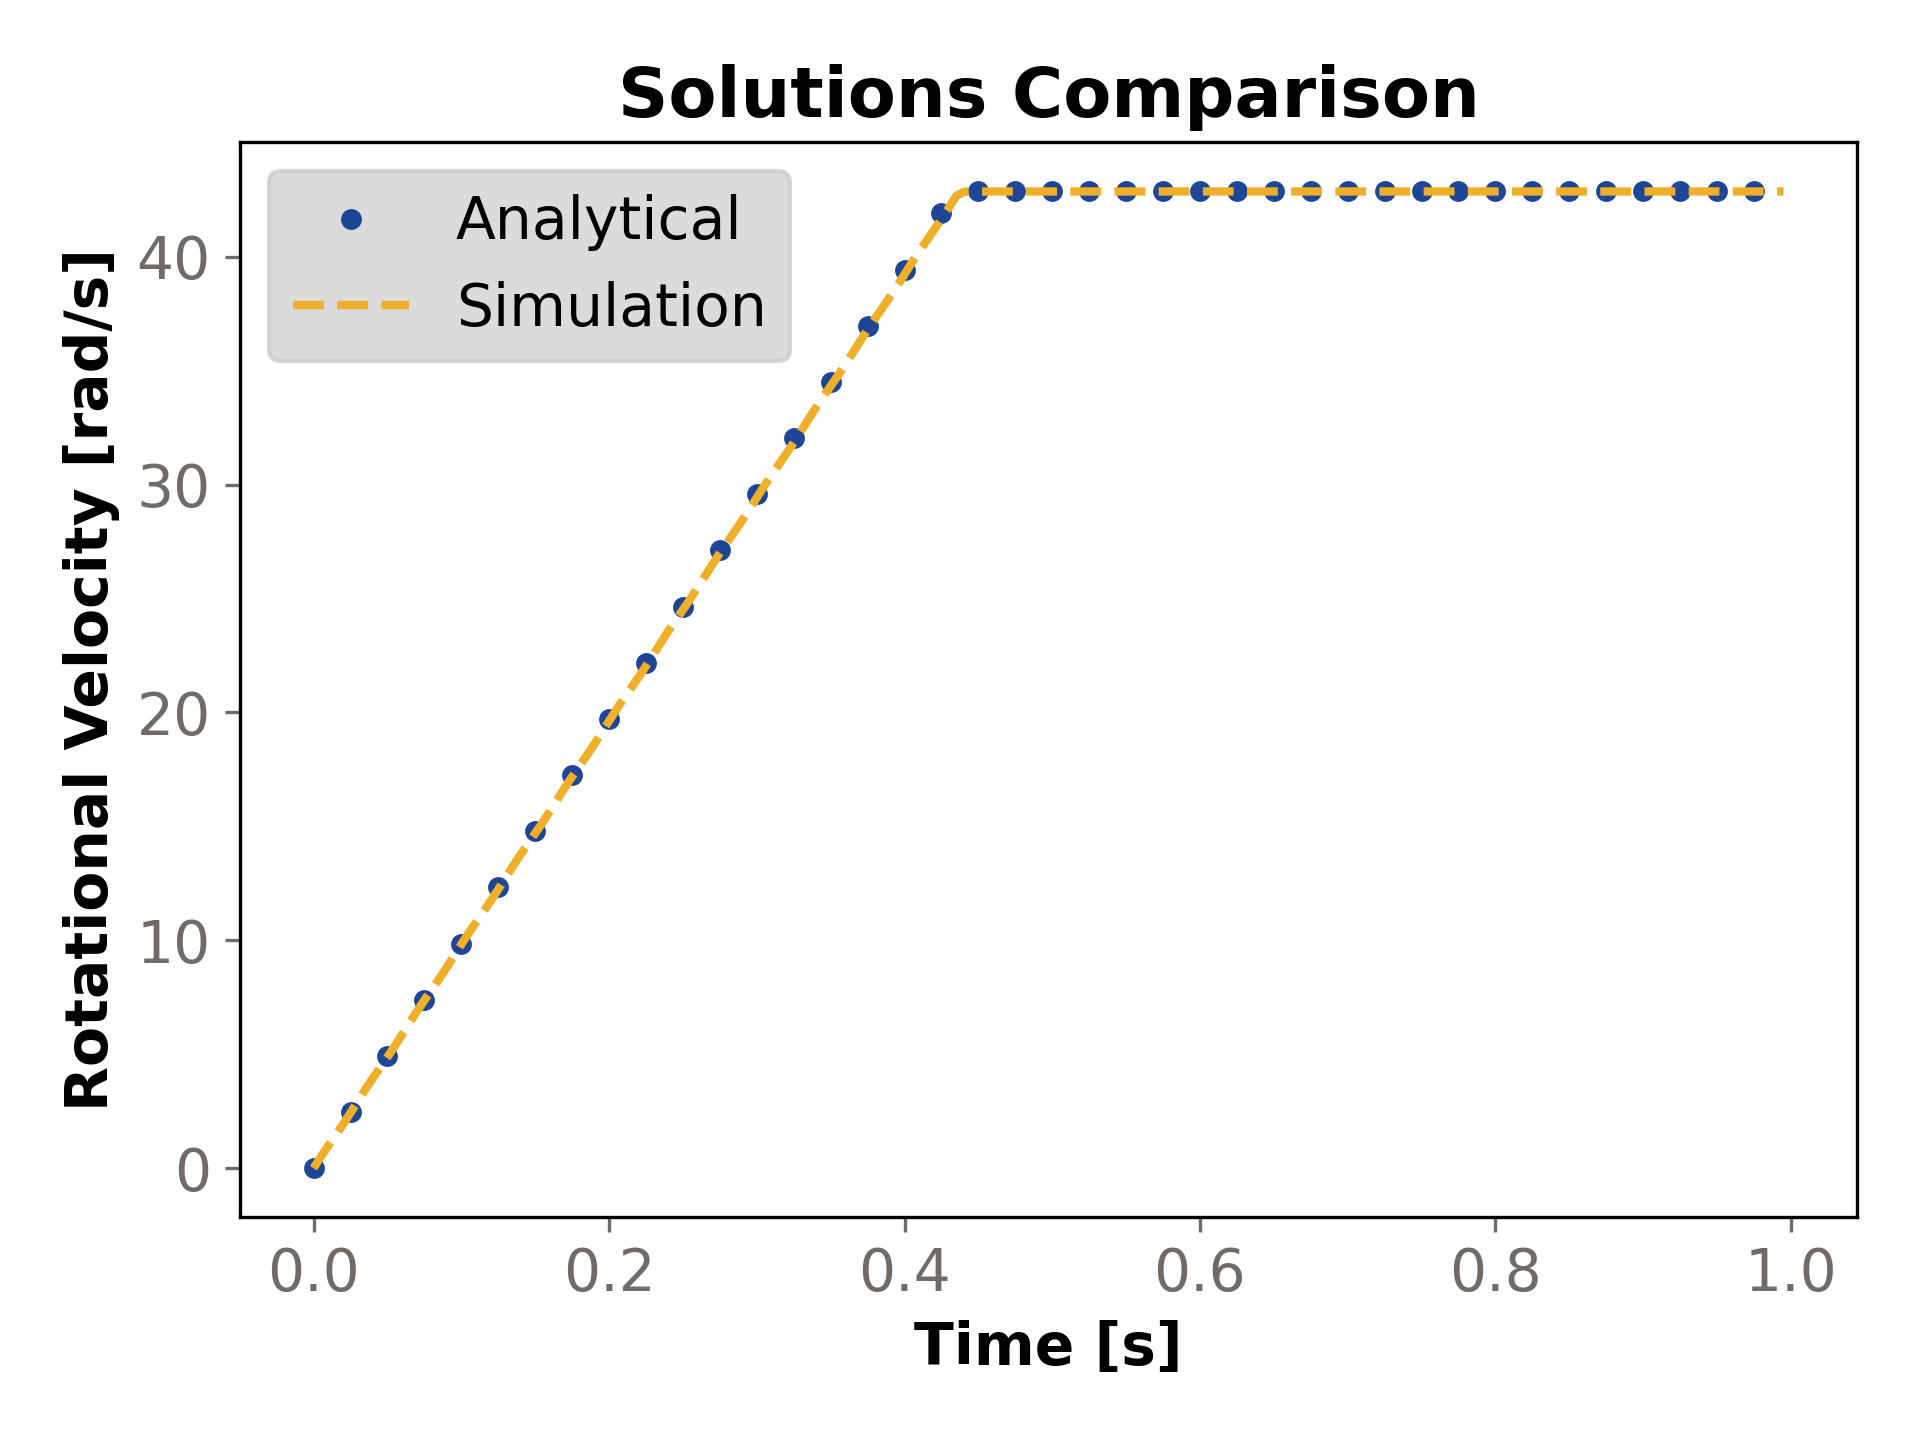
After running the Rocky case as specified, the results can then be compared to the analytical values. Here, the evolution of the translational and rotational velocities over time are shown in Figure 2.3: Comparison of the ball particle's translational velocity. and Figure 2.4: Comparison of the ball particle's rotational velocity., respectively. The numerical solution given by Rocky presents strongly correlated values to those obtained by the analytical expressions.
The absolute and relative errors for the particle velocities are compared in Figure 2.5: Translational velocity absolute and relative errors. and Figure 2.6: Rotational velocity absolute and relative errors.. The maximum absolute errors for the translational and rotational velocities are around 0.005 m/s and 0.25 rad/s, respectively. The maximum relative errors are around 0.23% and 4.5%, respectively.
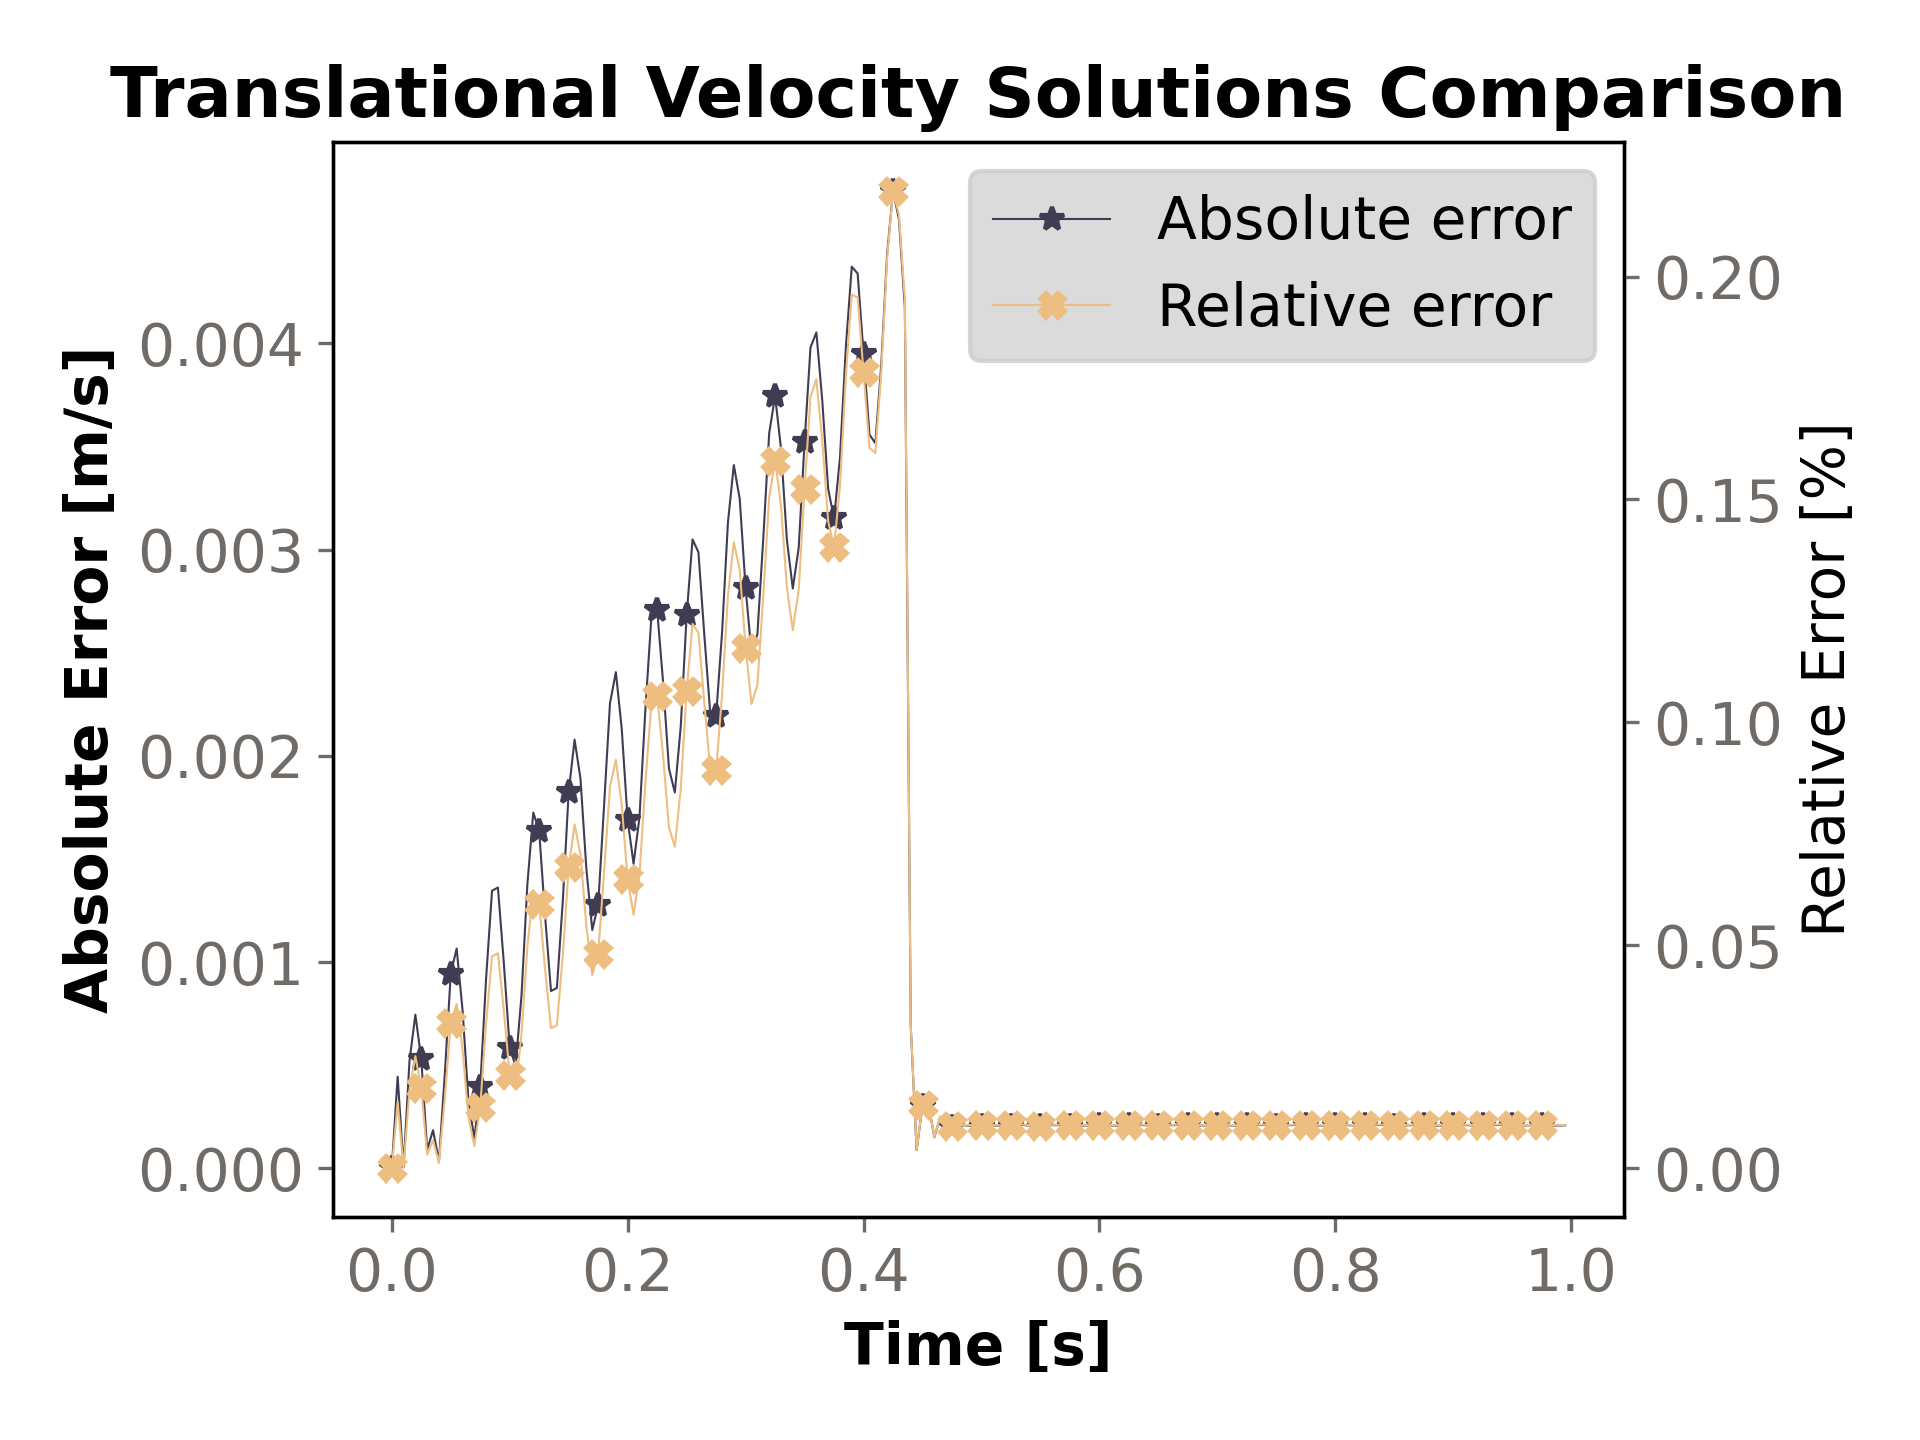
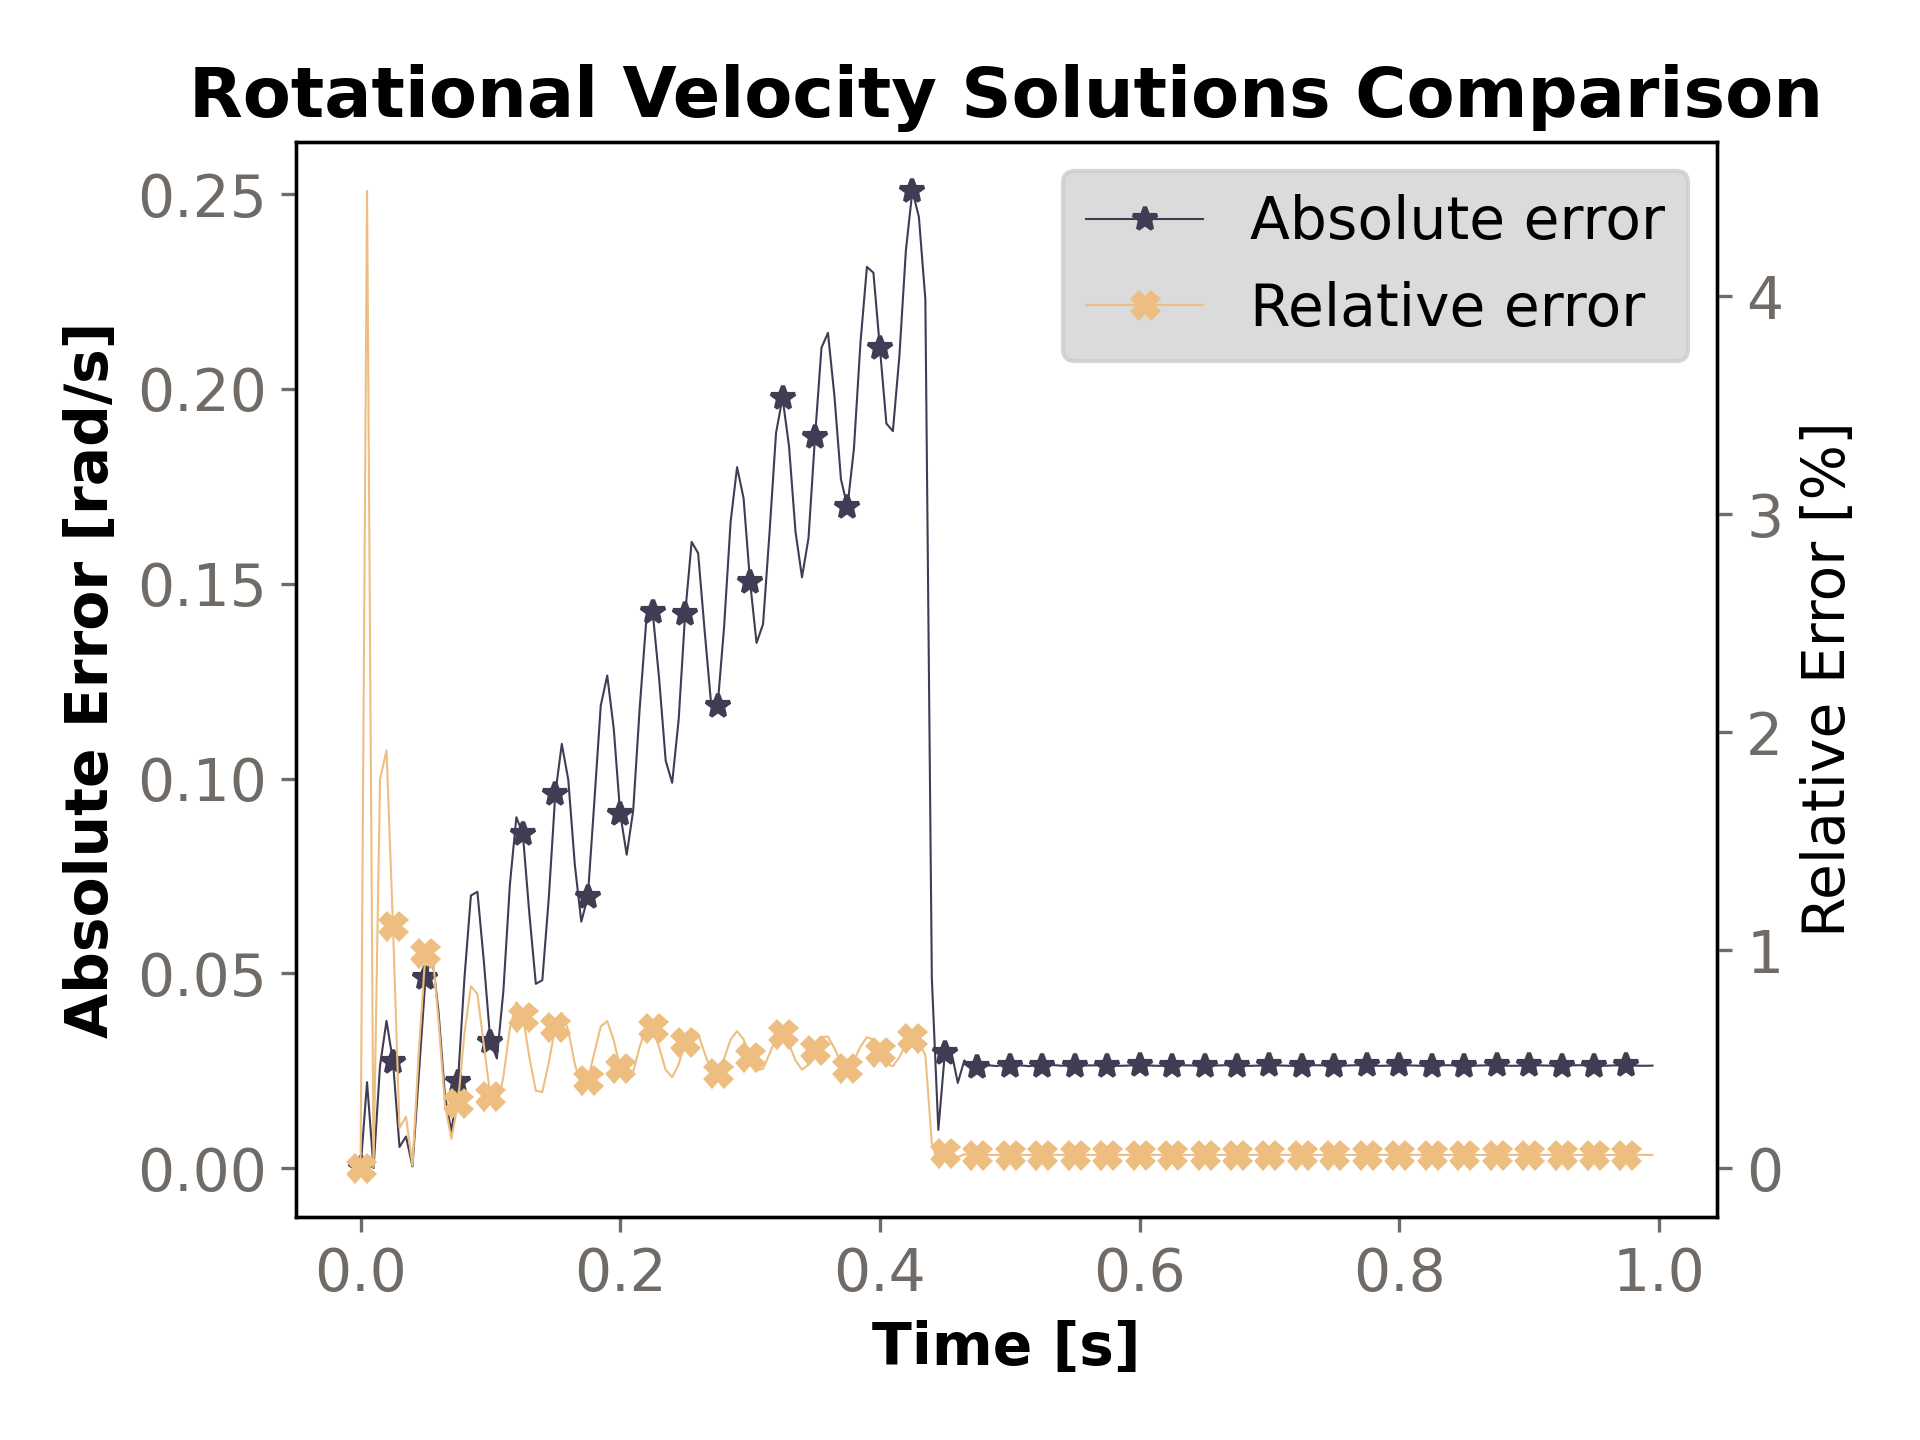
Table 2.2: Translational and rotational velocities targets lists the values for the final translational and rotational velocities. These include the target values calculated by the analytical expressions, the numerical results calculated by Rocky, and the ratio between both, which shows a strong correlation between results.
Table 2.2: Translational and rotational velocities targets
| Target | Rocky | Ratio[-] | |
|---|---|---|---|
| Translational Velocity [m/s] | 2.14224 | 2.14245 | 1.00009 |
| Rotational Velocity [rad/s] | 42.88794 | 42.86162 | 0.99939 |