Exercise 1: Selection using a Chart Stage
Use the Index line and Box selection tools to select materials based on their attribute values.
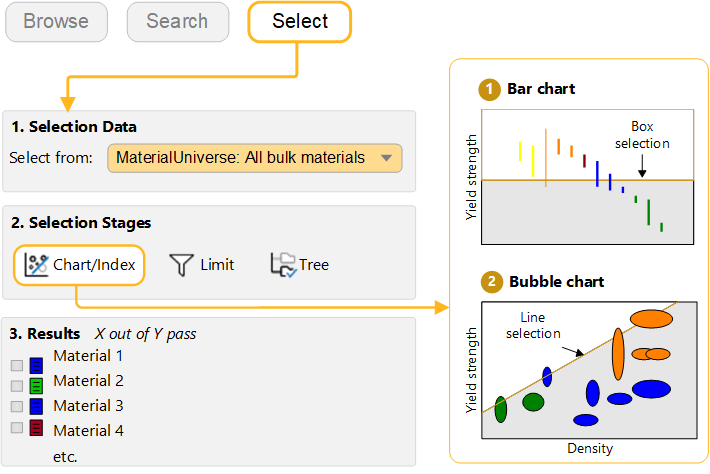
When plotted on a Chart Stage, records can be filtered using the Index line and Box selection tools. This provides a more qualitative approach to filtering.
-
Use a box selection to identify materials with high values of Yield
strength
Click
 Box selection, then drag to
define the selection box.
Box selection, then drag to
define the selection box.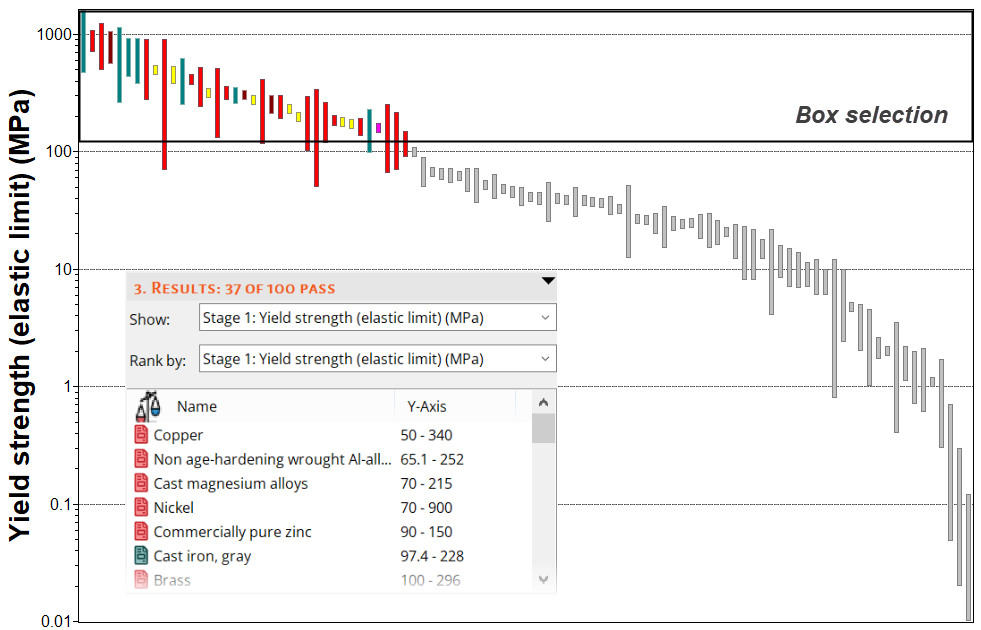
-
Add Density (ρ) to the other chart axis
Click
 Chart Settings, and on the
X-Axis tab, select Density as
the axis attribute.
Chart Settings, and on the
X-Axis tab, select Density as
the axis attribute. -
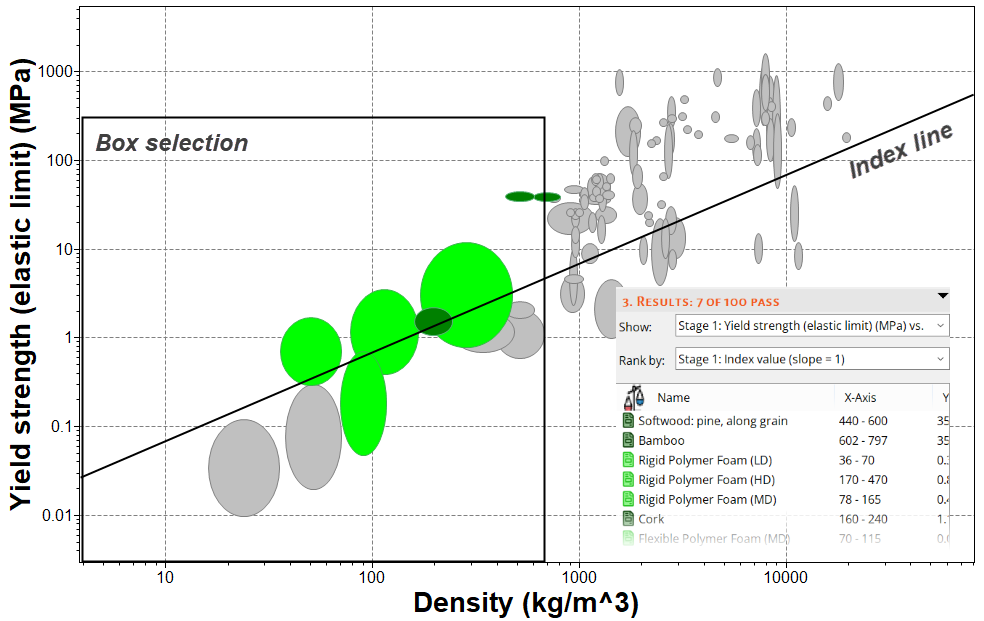
Use an Index Line to identify materials with high values
of specific strength σy / ρ
Click
 Index line.
By default, the slope of the line is 1 and the objective is Maximize the index. This will result in selection of materials above the line, for high values of σy / ρ.
Click OK and then click the chart to position the line through a particular point.
Drag the line upwards to refine the selection to fewer materials.
-
Add a Box selection to the chart to identify materials
with low Density that maximize the index.