Adjusting Plot Properties
Follow this procedure to change the various properties of the X- and Y-axes.
- Change
the Y-axis Properties.
- Position the cursor over any part of the Y-axis labeled 0.1k*LOAD.VAL on the plot. The arrow will turn green when hovering over a selectable area of the axis. Click an axis to select it for editing. The axis scale becomes bold when selected. The axis name and scale numbers will also be underlined.
- In the Properties window, select the Scaling tab.
- Select the Specify Min check box and type -0.5k in the Min Value field below it.
- Select the Specify Max check box and type 1.5k for the Max Value.
- Select the Specify Spacing box and change the Spacing value to 500. This setting controls the interval between major “tick” divisions on the axis scale.
- Change Minor Tick Divs to 1. This setting controls the number of divisions between major divisions.
- Repeat steps a through f for the Y- axis labeled DCM.N.
- For 10*DCM.IA Y-axis, first clear the Auto Units check box and set Units to A, then repeat steps a through f.
- Change
the X-axis Properties.
- Select the X-axis for editing.
- On the Scaling tab, clear the Auto Units check box and select a Units setting of s (seconds).
- Set Min value to 0, Max value to 0.1, Spacing to 0.01, and Minor Tick Divs to 1.
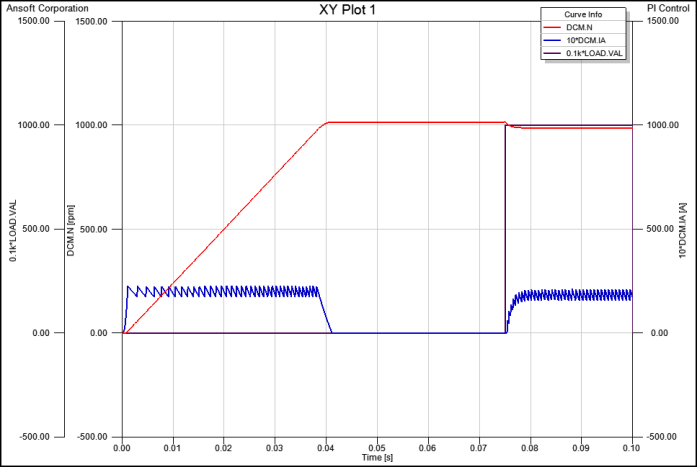
The finished plot should look similar to this image:
- Refer to the help for additional information on adjusting plot properties.
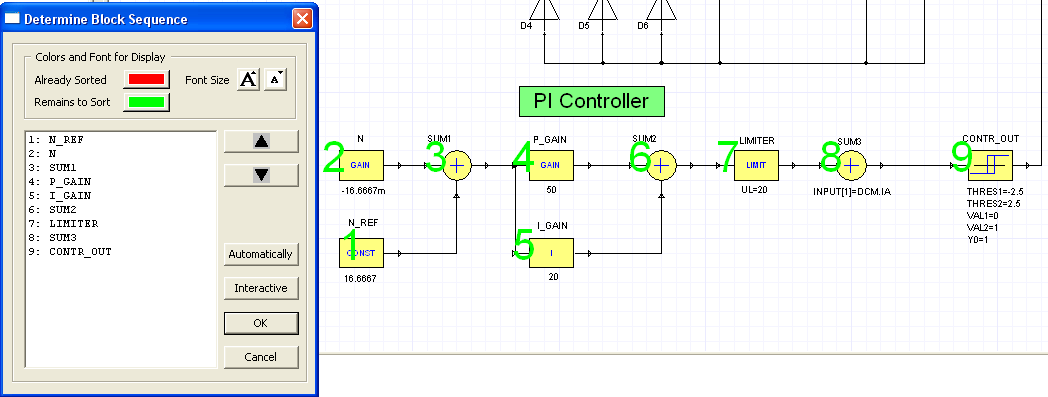
The sequence of block computation can significantly influence the simulation result. Select Schematic > Sort Components to change the block sequence.