
Monitor Report
In addition to using the Thermal Monitor window to display transient temperature results at monitor points, you can generate a monitor report of global or user-defined monitor point temperatures versus time. This type of report is only available in Mechanical designs of the Transient Thermal solution type. The following display types are available for monitor reports:
- 2D (Rectangular)
- Stacked
- Data Table
- 3D
- 3D Rectangular Bar
- 2D Contour
In this topic, we will focus on the display types that are most likely to be used for thermal monitor reports, specifically, Data Tables, 2D (Rectangular) plots, and Stacked plots. The procedure for creating other types of plots is similar. Since this report type is specific to transient solutions, the X axis will be Time in all cases.
The available thermal results are listed and described in the Results introduction. For thermal monitors, the global maximum temperature monitor is listed as a Quantity when the Global Category is selected in the Report dialog box. User-defined thermal monitor points are listed when the Monitor Category is selected. Examples of Data Tables, 2D plots, and Stacked plots follow:
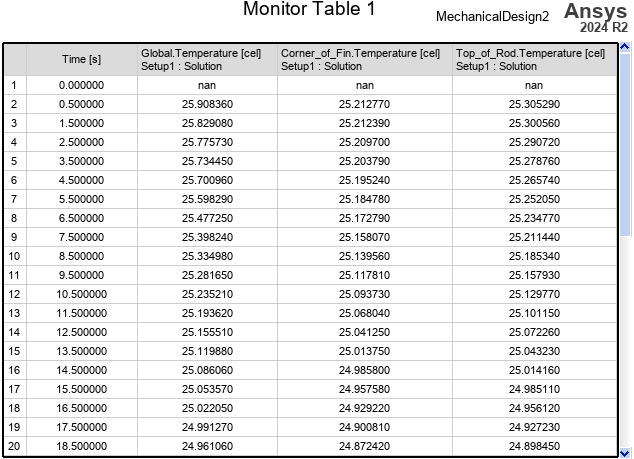
- Data Table: The same information is available as for curve plots, but the information is presented as tabulated numerical results.
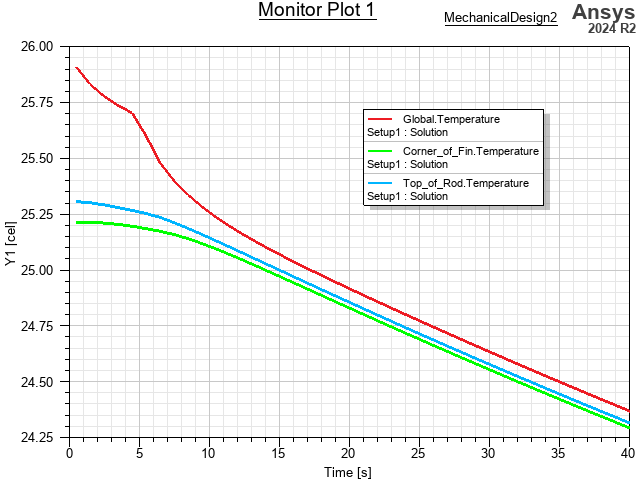
- 2D (Rectangular) Plots: This display type produces continuous traces by default. You can plot one quantity or multiple quantities using this format, with all of the results sharing the same Cartesian grid and axes.
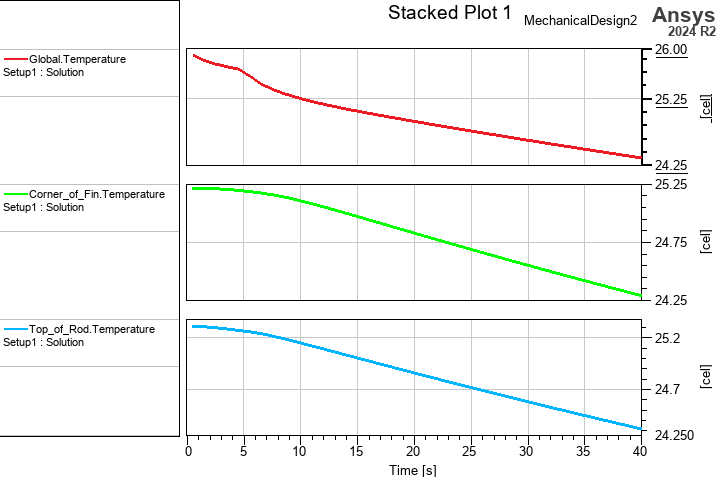
- Stacked Rectangular Plots: This display type is intended for multiple traces. Unlike the 2D plot previously described, this type puts every individual trace in a separate Cartesian grid stacked vertically. The X scale is shared by all traces, but the Y scale is adjusted to suit each individual trace.
The following image is an example of a data table listing temperature versus time for the global maximum and two user-defined monitor points. The Number Format for the Mode column was changed to integer, the Field Precision of the ModeFreq column was reduced to 2 (decimal places), and the column widths were customized:
Tables are also well suited for presenting results on which you have performed mathematical operations (such as reporting the maximum, minimum, or average values).
The following image is based on the same solution results as the preceding data table example:
The following image is based on the same solution results as the preceding data table and 2D plot examples:
See the subtopic, Creating a Monitor Report, for step by step instructions on creating and customizing thermal monitor reports.