


Configuration Matrix Spot Diagram

Show spot diagram as a matrix of individual diagrams, with each field along a row and each configuration down a column.
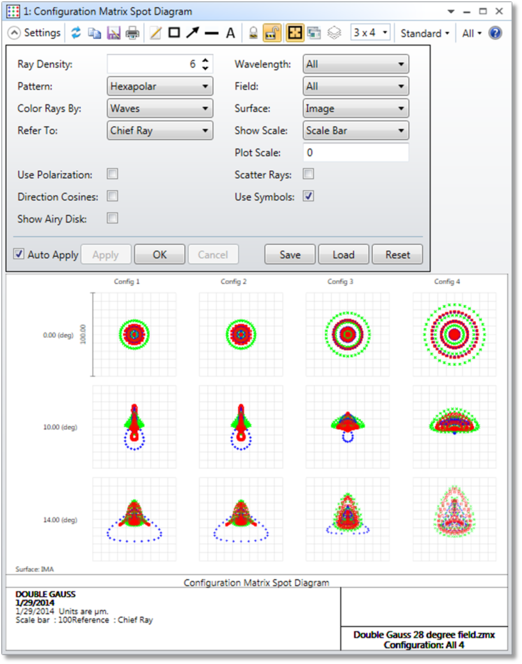
The options for the configuration matrix spot diagram are similar to those for the standard spot diagram.
Discussion
The configuration matrix representation is a convenient way of distinguishing the components of configuration dependent aberrations. Along the left side of the plot the field positions are listed; only the field positions for the last configuration are listed if more than one configuration is shown and the field definitions are part of the multi-configuration data which changes.
Next: