Sherlock's Thermal Mech feature analyzes Circuit Card Assemblies (CCA's) to assess potential solder failures caused by thermal cycling. These failures are driven by differences in the coefficients of thermal expansion (CTE) among the various materials which comprise the assembly. The different expansion rates of the parts and ensuing deformations account for stress in the assembly. The different expansion rates and the ensuing deformations during thermal cycling causes stress in the solder joints. Repeated exposure to such conditions leads to fatigue, eventually resulting in joint failure.
When you run a Thermal Mech Analysis, Sherlock captures the strain that drives solder fatigue failure. When calculating the strain range (Δstrain) for ball grid arrays (BGA's), Sherlock uses elemental equivalent strain from the minimum and maximum temperature contained in the Thermal Profile. For other leaded devices, Sherlock also provides the strain range for the leads. For components that are not leaded (or when you choose not to include leads in the analysis), Sherlock provides board strain ranges. Sherlock does not make any predictions with the strain range as of Sherlock 2023 R1. However, the strain range could be easily exported to make failure predictions outside Sherlock.
Running a Thermal Mech Analysis involves setting up a Finite Element (FE) model of the board and analyzing the model using the Ansys Mechanical solver. The Sherlock interface provides a streamlined method for setting up the FE model with the appropriate boundary conditions to simulate various thermal loading scenarios. You define thermal load(s) using Sherlock's Thermal Event Editor under Life Cycle in the Project Tree.
Once the model is solved, Sherlock determines the strain range (Δstrain) for each part and tabulates the results. Sherlock also displays results graphically: Board displacement, stress, and strain are displayed in the Layer Viewer (2D) and the 3D Results Viewer. More on the results are provided in the section below Thermal Mech Analysis Results.
Warning: Exercise caution when using multiple versions of Sherlock on the same project. To avoid inaccurate results, see the section Compatibility with Earlier Versions of Sherlock.
In this section, the following topics are covered:
- 9.6.1. Thermal Mech and Material Properties
- 9.6.2. Thermal Mech and Input Data
- 9.6.3. Overview of Thermal Mech Analyses
- 9.6.4. Thermal Mech Properties Dialog
- 9.6.5. Types of Thermal Mech Analyses
- 9.6.6. Summary of Analysis Combinations
- 9.6.7. Thermal Mech and Mount Points
- 9.6.8. Part Temp Rise and Thermal Map FAQ
- 9.6.9. Imported Data Source
- 9.6.10. Thermal Mech Analysis Results
The Thermal Mech Analysis Module makes use of the following material properties when building FEA models:
Density
Elastic Modulus
Poisson Ratio
Coefficient of Thermal Expansion
Thermal Conductivity
Secant Modulus (BGA's only)
In Sherlock, you can define part properties in the Material Manager. To define solder and laminate material properties, use the Solder Manager and Laminate Manager respectively.
Sherlock runs a linear elastic, static structural analysis or a steady state thermal analysis followed by a static structural analysis, depending on the thermal boundary conditions. Creep properties for the solder are considered only for BGAs as a temperature dependent secant modulus. In general, thermo-mechanical simulation which targets solder failure in electronics uses creep models such as Garofalo or Anand's plastic model. However, running a board level analysis with creep models involving thousands of solder geometries is computationally expensive. On the other hand, simplifying the analysis with a linear elastic solder model will under-predict damage.
Sherlock strikes a balance by using the secant modulus for solders. You can run a simple pull test in Ansys Mechanical with creep models and identify the secant modulus at a strain of your choice and then use it in Sherlock for the solder material. Sherlock does not require you to use its default material properties. For example, Sherlock provides a set of secant properties for SAC305 and SnPb at 0.2% strain from a tensile pull simulation carried out at strain rate of 1e-4 strain/second. If this value does not suit your purposes, you can override this property with a custom secant modulus.
Note: Missing Property Values: In the unlikely event thermal conductivity values are missing for a material, Sherlock logs an analysis issue (and console message) such as the one shown here:
TM: No thermal conductivity defined for FERRITE, using 1.0e-4
W/m-K |
As the message indicates, Sherlock automatically uses a default thermal conductivity value of 1E-4 W/m-K. To eliminate such warnings, use the Material Manager to add the proper value.
The Thermal Mech Analysis Module makes use of the following input data:
Thermal Events and Custom Uniform Temperatures
Part Temperature Rise, Thermal Map (CSV), Thermal Map (Image)
Tip: The following section explains which part properties Sherlock uses in the Thermal Mech analysis: Tables: Required Part Properties per Analysis Type.
Size and location of all parts, plated through-holes, and cutouts
Circuit card mechanical properties (stackup data)
Note: For BGAs, you may choose to import a Net list. This allows you to change the location of the solder balls.
Sherlock allows you to perform several kinds of Thermal Mech Analyses. The following list is an overview and will be further explained in subsequent sections.
Using Thermal Events: Thermal Events in Sherlock are temperature profiles you create which are applied to the electronic assembly during a Thermal Mechanical Analysis. When you create a Thermal Event, you define a temperature profile and specify the number of cycles it will be applied to the electronic assembly. (See Project Life Cycles for how to create Thermal Events.)
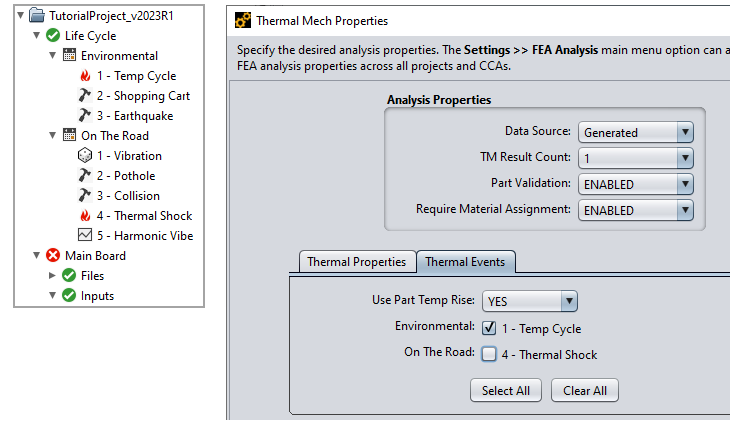
For this kind of analysis, you select Generated as the data source in the Thermal Mech Properties window, as shown below. Use the Thermal Events tab to select which Thermal Events apply to the analysis.
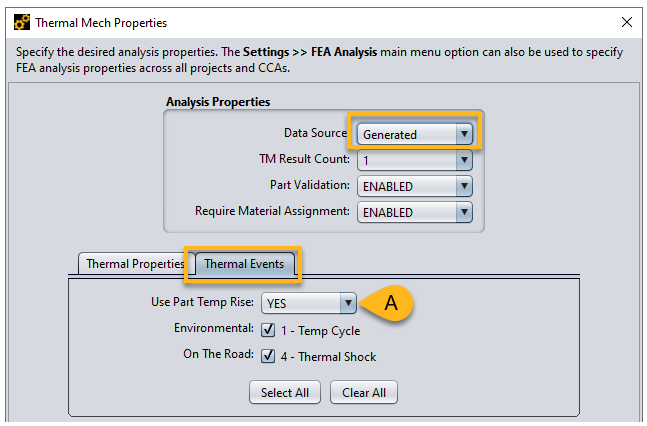
Thermal Events with Part Temperature Rise: Select YES for Part Temp Rise (A, above) if you want Sherlock to incorporate the Part Temp Rise property into its analysis. Part Temp Rise is a part property that specifies a part's temperature rise that occurs during the device's operating conditions.
For a given Thermal Event, Sherlock will raise the temperature for those parts for which Part Temp Rise has been set and will solve for temperature distribution across the board for the new thermal load. The thermal distribution is then used in the structural analysis to solve for deformation and strain.
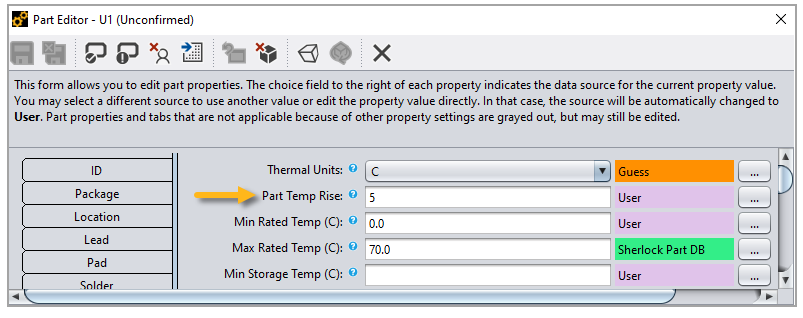
For this kind of analysis, you must first specify the Part Temp Rise property for the relevant parts in your Parts List, using the Part Editor (see below). As explained later, it is not necessary to set Part Temp Rise for all the parts in your Part List.
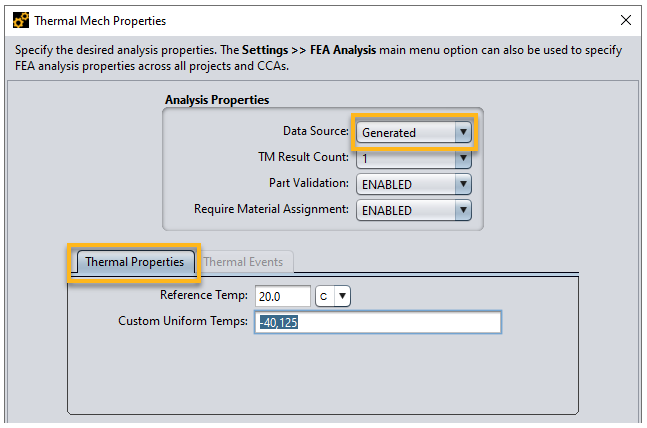
Isothermal Analysis: In Sherlock, you can run an isothermal thermo-mechanical analysis using custom temperature points. This is an easy way to run a quick ramp-up or ramp-down analysis without defining Thermal Events. This feature is exclusively used for running isothermal analysis and does not support any type of heat transfer analysis. Sherlock uses the custom temperature points to apply the uniform temperature in Ansys Mechanical. To run an isothermal analysis, choose Generated as the Data Source, and enter the temperature information using the Thermal Properties tab as shown below.
Conduction Analysis: Sherlock also supports thermal conduction analysis. If you know the temperature of the part at each step of the thermal profile or have the temperature distribution of the TOP and (or) BOTTOM face of the PCB, you can run thermal analysis using Part Temperature Rise and Thermal Mapping techniques in Sherlock.
Part Temperature Rise allows you to define the temperature rise of components caused by heat generation during operating conditions. On the other hand, if you have information on the absolute temperature of the parts, you can use Thermal Map (CSV). More details on how to add Part Temperature Rise to the parts of a CCA, how to add thermal Image/CSV and, more importantly, how the different techniques are associated to the Thermal Events will be discussed later.
Limitation: If you select Abaqus (available in the Windows version only) to run the Thermal Mech analysis (see Selecting the FEA Engine), the following features are not supported:
Part Temperature Rise
Thermal Map using a CSV
Thermal Map using an Image
The Thermal Mech Properties dialog is the interface for setting up any Thermal Mech analysis. To open the dialog, right-click Thermal Mech in the Project Tree as shown below and select Edit Properties in the context menu.
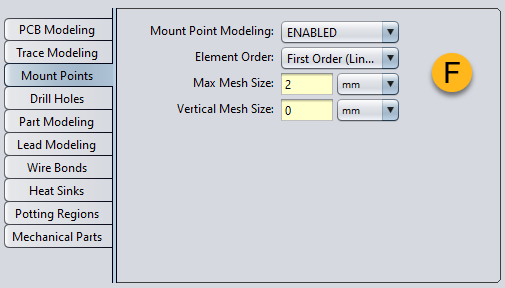
The inputs required for the analysis (with Data Source (B) set to Generated) can be seen in the image below. They are categorized into: Thermal Properties(C), Thermal Events (D), Analysis Properties (E), and Modeling Properties (F).
Note: If you change any of the input data, Sherlock will automatically clear previous Thermal Mech analysis results. If you want to keep your results, be sure to save them before proceeding.
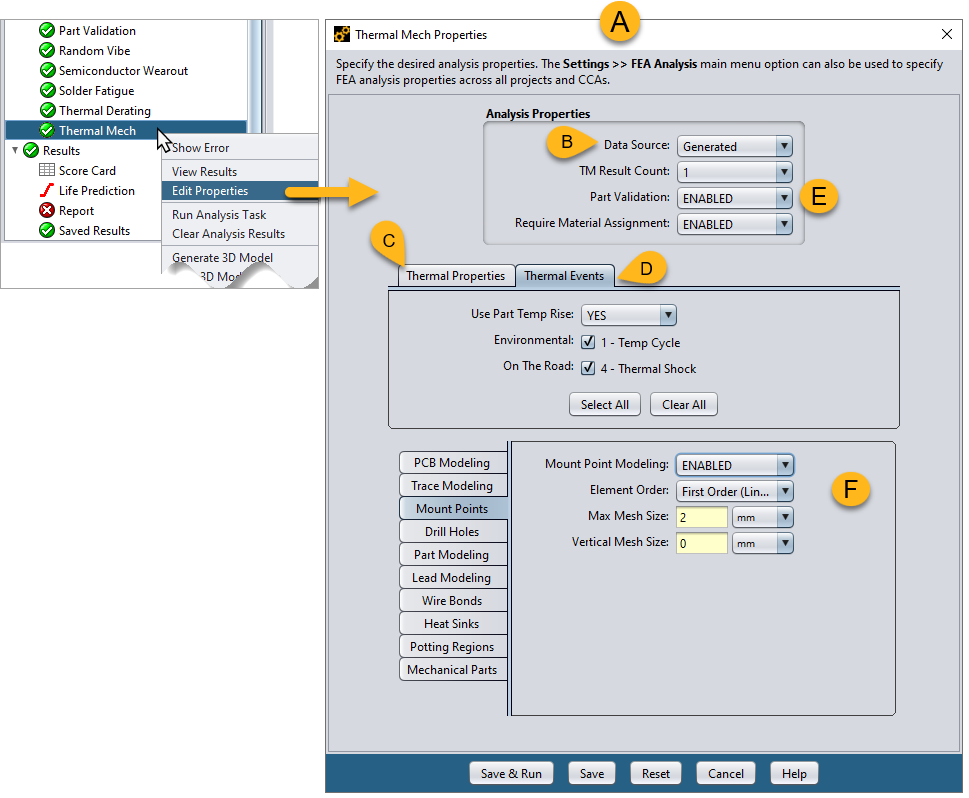
Data Source (B): From this dropdown menu, specify how Sherlock will obtain the results used to calculate strain. Select one of two data sources: Generated or Imported.
Generated: When selected, you are tasking Sherlock to generate the results which are then used to calculate strain. Sherlock runs the FE model in batch mode based on the FE solver selected and post processes the results for strain.
Imported: Select this option if you wish to import results files created by other applications such as Ansys Mechanical (.rst) or Abaqus (.odb). Sherlock performs the post-processing calculations and determines strain based on the result files provided.
Thermal Properties / Thermal Events tabs:
Thermal Properties (C above): The Thermal Properties tab allows you to run a ramp-up or ramp-down analysis requiring minimal inputs. This feature is exclusively used for running isothermal analysis and does not support any type of heat transfer analysis. Sherlock uses the custom temperature points (Custom Uniform Temps) to apply the uniform temperature to the assembly.
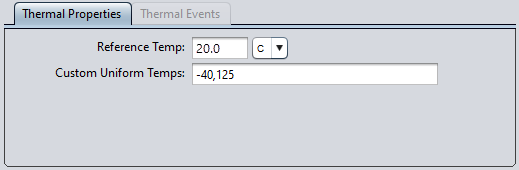
The reference temperature for the ramp is set using the Reference Temp field. This defines the temperature at which the model exhibits no thermal expansion. Typically, room temperature (20°C) is chosen as shown in the example above. Use the dropdown menu to change the units of temperature if desired (C, F, or K).
Note: The temperature unit selected from the dropdown menu applies only to the Reference Temperature. Units for the Custom Uniform Temps field are handled differently as explained below.
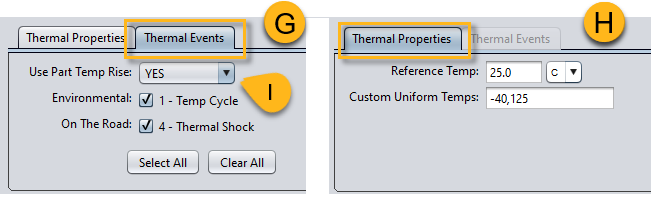
As shown (H, below), the Custom Uniform Temps field can take multiple temperature values, separated by a comma. The default unit is Celsius. However, each temperature you enter can have its own unit. For example:0°C,32°F, 273.15 K all specify the same temperature using different units.
If a single temperature is provided, Sherlock will run a ramp-up (or ramp-down) analysis from the reference temperature. If you define multiple temperature data points, Sherlock will run a multi-step structural analysis with each step corresponding to one of the defined temperature points. For example, when Reference Temp is set to 25°C and Custom Uniform Temps of -40°C and 125°C are applied, Sherlock will run a two-step static structural analysis, where the first step is ramped from 25°C to -40°C and the second is ramped from 25°C to 125°C.
Thermal Events Tab (G, below): Thermal Events in Sherlock are temperature profiles applied to the electronic assembly during a Thermal Mechanical analysis. When you create a Thermal Event, you define a temperature profile and specify the number of cycles it will be applied to the electronic assembly. The example shown below comes from the tutorial project: Two Thermal events have been selected: 1 - Temp Cycle and 2 - Thermal Shock. How to create a Thermal Event is explained in the Life Cycle Management section.
When running an analysis based on Thermal Events, you may select the option for Sherlock to Use Part Temp Rise (I, below). This is a part property which you can define using the Part Editor. These settings will be explained in more detail. See Thermal Events with Part Temperature Rise below.
When Use Part Temp Rise is set to NO, Sherlock will skip the thermal analysis (unless the thermal event is associated with Thermal Maps) and run an isothermal analysis by applying uniform temperature from the Thermal Profile throughout the circuit under static structural analysis.
It should be noted that Part Temp Rise value set under each part will be used only if Use Part Temp Rise is set to YES. In the Part Editor, you can set Part Temp Rise as a positive temperature value, or you can set it to DEFAULT. When set to DEFAULT, Sherlock does not apply any temperature boundary conditions to the part. Rather, Sherlock solves for its respective nodal temperature based on other boundary conditions.
Note: If the Thermal Events tab is inactive, clear any data from the Custom Uniform Temperature field under the Thermal Properties tab. Any data in the field automatically deactivates the tab.
Tip: For a basic introduction on Project Life Cycles, refer to Project Life Cycle in the Project Overview tutorial.
Read Life Cycle Management for an overview of the following concepts: Life Cycle Management, Phases, and Events.
For instructions on creating Thermal Events and Thermal Profiles, read the section Thermal Event.
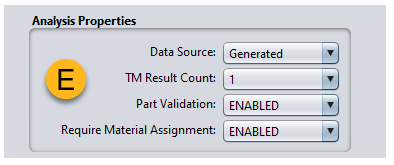
Analysis Properties Panel (E, below)
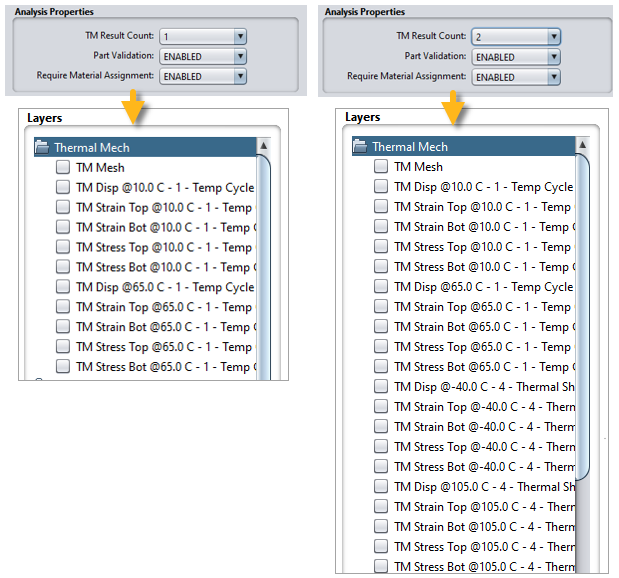
TM Result Count: This value specifies the number of results Sherlock will display in the Layer Viewer in the event of multiple Thermal Events. For example, if you set the TM Result Count to 2, if there are multiple events, Sherlock will display results for the two Thermal Events that caused the highest strain values. Currently, Sherlock caps this value at 4. Setting it to 1 gives you the worst-case scenario.
Part Validation: When this is ENABLED, Sherlock will run a parts property validation against the Part Library and/or the Approved Vendor List before building the thermal mech model. This prevents long-running analysis based on part properties that have not been validated.
Required Material Assignment: If enabled, you must explicitly define material assignments. If set to NOT ENABLED- Sherlock uses default material properties.
Modeling Properties Panel:
The Modeling Properties panel in the Thermal Mech Properties dialog provides the necessary options to control mesh as well as the geometry of the FE model. The Finite Element Analysis (FEA) model created by Sherlock for Thermal Mech analysis is basically the same as those created by other analysis modules, such as Mechanical Shock, Harmonic Vibration and Random Vibration. The only difference is that temperature dependent material properties are included in the model for the solder geometry if defined. All other model properties, such as the inclusion of PCB traces, parts, leads, and heat sinks, for example, are used the same way as in the other analysis modules.
Note: If you wish to model component leads in your analysis, it is currently recommended that you export the project file to Ansys Workbench Products. Generate the FEA model, run the analysis in Workbench, and import the results back into Sherlock. See FEA-20 Ansys Workbench Integration for details.
For a full explanation of the Modeling Properties tabs and options, see FEA Modeling Properties. Remember, you can apply specific FEA analysis options across all projects and CCAs by using the FEA Analysis Settings dialog found under Sherlock's main menu: Settings > General Settings > FEA Analysis. See FEA Analysis Settings for a guided explanation.
Sections Below:
Thermal Events (C) with Part Temperature Rise: Part Temperature Rise allows you to define the temperature rise of components due to heat generation during operating condition. You can run thermo-mechanical analysis with Part Temperature Rise by setting the Use Part Temp Rise to YES, as shown below. Additionally, you must specify the temperature rise for the parts from Parts List.
For a given Thermal Event, Sherlock will raise the temperature for those parts for which Part Temp Rise has been set and solves for temperature distribution across the board for the new thermal load. The thermal distribution is then used to solve for deformation and strain from structural analysis. You can set the temperature rise for each part in the circuit from Part Editor as shown below.
Part Temp Rise for all the parts in the circuit card can be viewed under the Parts List as shown below. You may need to customize the table to see the Part Temp Rise column as explained in Customizing the Parts List.
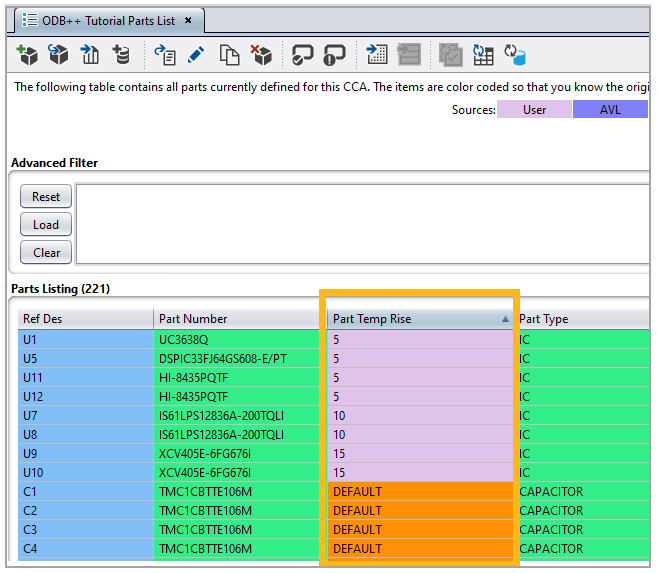
It should be noted that Part Temp Rise value set under each part will be used only if Use Part Temp Rise is set to YES. In the Part Editor, Part Temp Rise can either take a positive value for temperature or can be set to DEFAULT. When a part is set to DEFAULT, Sherlock does not apply any temperature boundary condition to the part but rather solves for its respective nodal temperature based on other boundary conditions.
With the Part Temp Rise set for the components, Sherlock runs the analysis for the selected Thermal Event(s). Once the analysis is complete, Sherlock will read the result file and determine the strain range for the Thermal Event.
When Use Part Temp Rise is set to NO, Sherlock will skip thermal analysis (unless the thermal event is associated with Thermal Maps) and run an isothermal analysis by applying uniform temperature from Thermal Profile throughout the circuit under static structural analysis.
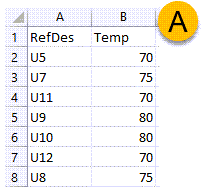
Thermal Events (C) with Thermal Map (CSV): Sherlock also supports running thermal analysis by assigning temperature to Parts using CSV file. This feature is termed as Thermal Map (CSV). With this new feature, Users can assign temperature to the Parts using their RefDes in the CSV file. The CSV file format is as shown below (A).
It should be noted that with Part Temp Rise, the temperature rise value in Part Editor is added to the part in addition to the temperature from Thermal Profile during the analysis. Unlike Part Temp Rise, temperature from CSV files is directly applied to the parts as is and is not an additional temperature value on top of the values from the Thermal Profile.
A CSV file formatted as shown above (A) can be added to appropriate Sherlock project under Files as shown below. Once the file has been added to the Project Tree, it should be edited for Thermal Map (CSV) application as explained in the example below.
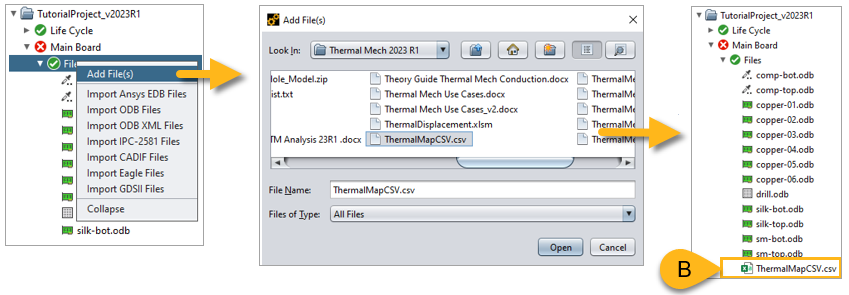
Example: To edit the CSV file, right-click the ThermalMapCSV.csv (B, above) in the project tree. This opens the Edit File Properties window (C, below). In Edit File Properties window, change the File Type to Thermal Map (CSV). This displays the Thermal Map panel (D).
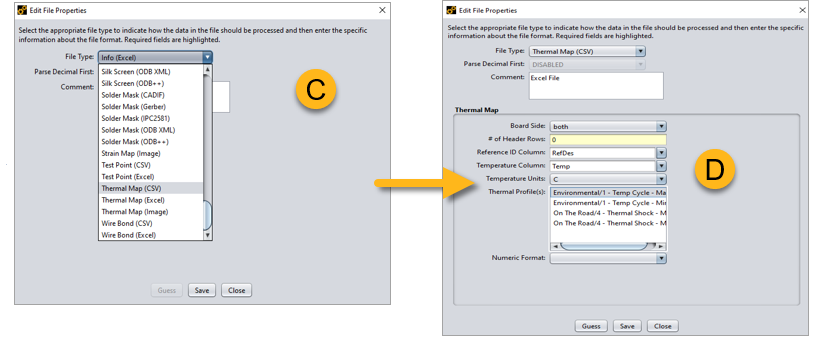
Thermal Map (CSV) options in the Edit File Properties window:
Board Side: The option is immaterial when using a Thermal Map (CSV).
# of Header Row: Specify the number of header lines in the CSV file.
Reference ID Column: Specify which column contains the reference designators (RefDes).
Temperature Column: Specify the column that lists the temperature data.
Temperature Units: Select the units used in the CSV file.
Thermal Profile(s): The panel lists the minimum and maximum step of all the Thermal Events defined under the project Life Cycle. It is imperative that the CSV file is associated with one or more Thermal Events.
Example of a Thermal Mech Analysis with a Thermal Map (CSV)
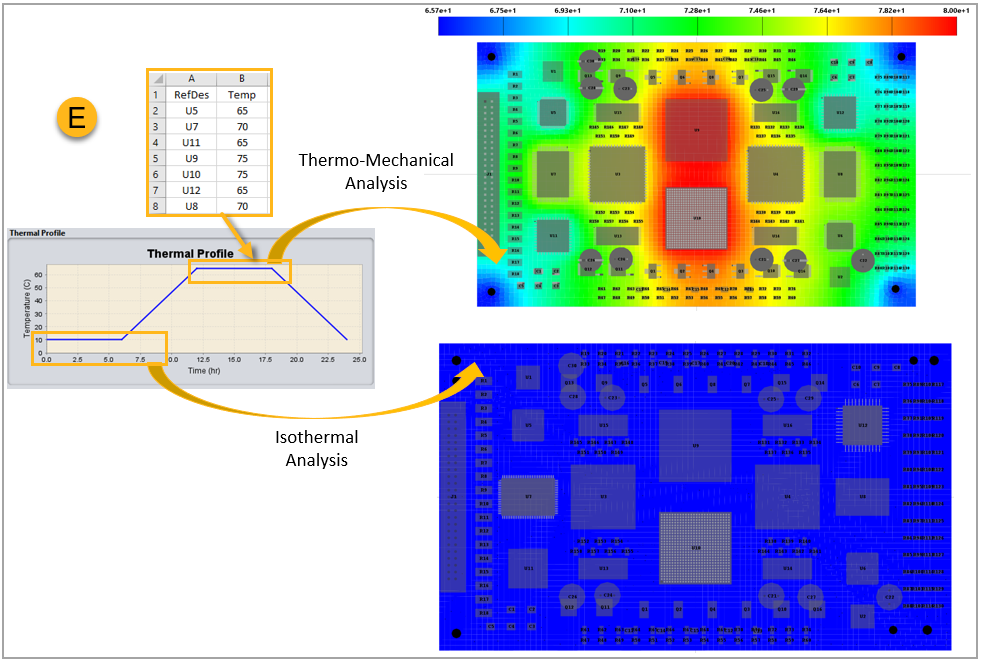
Consider a Thermal Mech analysis where the CSV file shown above (A) is associated with the Environment 1-Temp Cycle - Max, as shown in image D. Sherlock runs a two-step thermal analysis followed by a two-step structural analysis using the temperatures from the RTH file obtained from the previous thermal analysis.
As illustrated below (E), the two steps in the analysis correspond to the minimum temperature and the maximum temperature specified in the Thermal Profile of the selected Thermal Event. When the CSV is associated to Environment 1-Temp Cycle - Max, the part temperatures in the field are applied to the maximum step of the analysis only.
If no file is associated to the minimum step of the Thermal Event (Phase 1/Thermal Event - Min), Sherlock does not run a thermal analysis but instead applies the minimum temperature from the event as a uniform temperature across the circuit card. The temperature distribution across the circuit boards used for the static structural analysis is shown below (E).
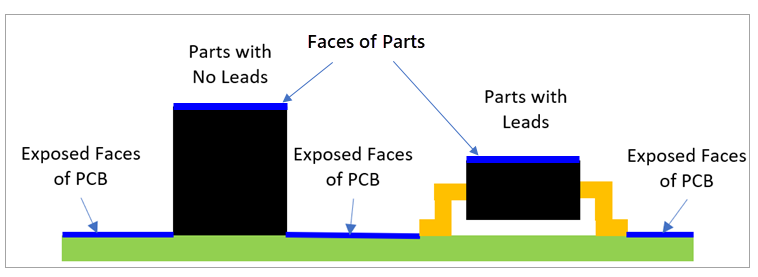
Thermal Events with Thermal Map (Image): You can provide temperature distribution data in image form, and Sherlock will run the thermal analysis using the image's temperature data and sequentially carry out a structural analysis to determine displacements and strains. When Thermal Map (Image) is used, boundary conditions are applied to all the exposed faces of the circuit card, including parts as well as the PCB, as shown below. This stands contrast to how a Thermal Map (CSV) is used, where Sherlock applies temperature as a boundary condition to parts only.
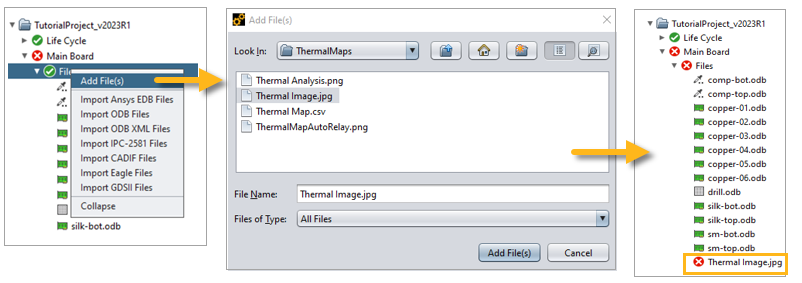
The process of adding a Thermal Map (Image) file to Sherlock is similar to a Thermal Map (CSV), as shown below.
Note: The file used in the following example is packaged with your Sherlock software in the following location (for a standard installation):
Windows:
C:/Program Files/ANSYS Inc/v242/sherlock/tutorial/ThermalMaps
Linux:
/ansys_inc/v242/sherlock/tutorial/ThermalMaps
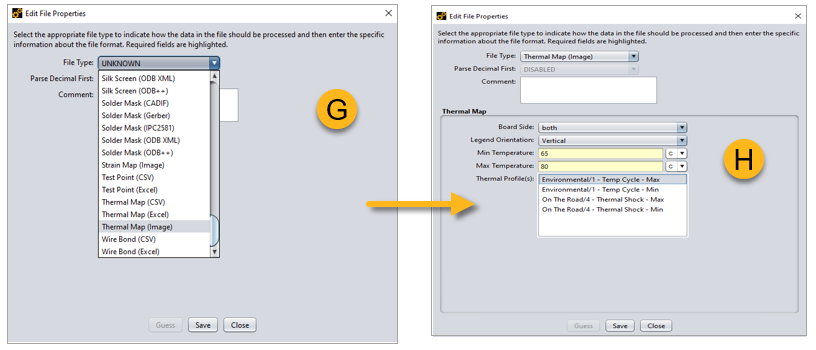
Once the file has been added to the Project Tree, it should be edited for a Thermal Map (Image) application: Right-click the image file in the Project Tree and select Edit Properties in the context menu. This opens the Edit File Properties window (G). You must change the File Type to Thermal Map (Image). This displays the Thermal Map (Image) options panel (H).
Thermal Map (image) options in the Edit File Properties window:
Board Side: Although this setting is not used for a Thermal Map (CSV), it is an important setting for using a Thermal Map (image). Use the dropdown menu to select whether the thermal map image applies to the top, bottom, or both sides of the board.
Legend Orientation: Indicate whether the legend in the temperature map is horizontal or vertical. This helps Sherlock associate the minimum and maximum temperatures with the correct ends of the legend bar.
Min Temperature and Max Temperature: Enter the minimum and maximum temperatures displayed in the thermal image so Sherlock knows the temperature range conveyed in the image. In the example shown above, the minimum temperature is set to 65°C, and the maximum temperature is set to 80°C.
Tip: The mount points of an electronic board are generally mounted to the casing. During operation, represented by a Thermal Cycle in Sherlock, the mount points are generally exposed to the Thermal Cycle temperature. So, it is important to provide accurate Minimum Temp and Maximum Temp during Thermal Mapping (Image).
When using a Thermal Map (CSV), Sherlock maintains the Mount Points at appropriate temperature based on the Thermal Cycle. In contrast, when using a Thermal Map (Image), Sherlock respects the Minimum Temp and Maximum Temp you entered. Sherlock does not force the Thermal Cycle temperature at Mount Points because this changes the contour you are providing in the thermal image.
However, when mount points are modelled as Mount Pads, Sherlock will maintain a temperature consistent with the Thermal Event. Therefore, it is important that you provide accurate Min and Max Temperature so they are consistent with that of the mount point. A mismatch in temperature near the mount point will cause high gradients across the mount pad.
Thermal Profiles: As with the Thermal Map (CSV), the Thermal Profile(s) selection panel lists the minimum and maximum steps of all the Thermal Events defined under the project Life Cycle (see H above). While using an image file, it is imperative to associate one (or more) thermal events with the image file.
Example of a Thermal Mech Analysis with a Thermal Map (Image)
The continuing example illustrates how Sherlock performs the Thermal Mech analysis when the ThermalImage.jpg file is associate with the Environment 1-Temp Cycle - Max Thermal Profile. In the Thermal Map panel (H, above), the image is associated with Environment 1-Temp Cycle-Max (H, above). Click Save to save the association.
Once the image association has been saved, you must align the image to the board outline and align the legends correctly. To access the alignment options, right click the Thermal Image in the Project Tree and select Edit Layer in the context menu, as shown below.
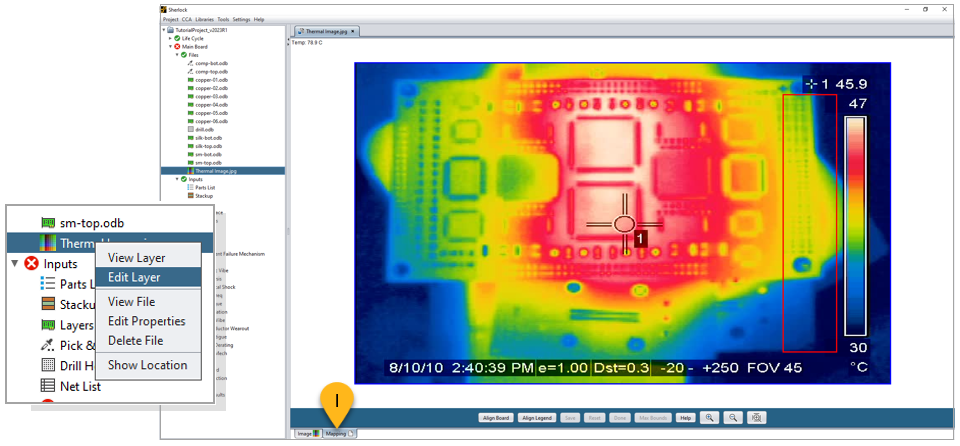
The option will open the Mapping tab (I, above), where you can align the board and the legend using the Align Board button and the Align Legend buttons. Sherlock marks the board with a blue outline and the legend with a red outline.
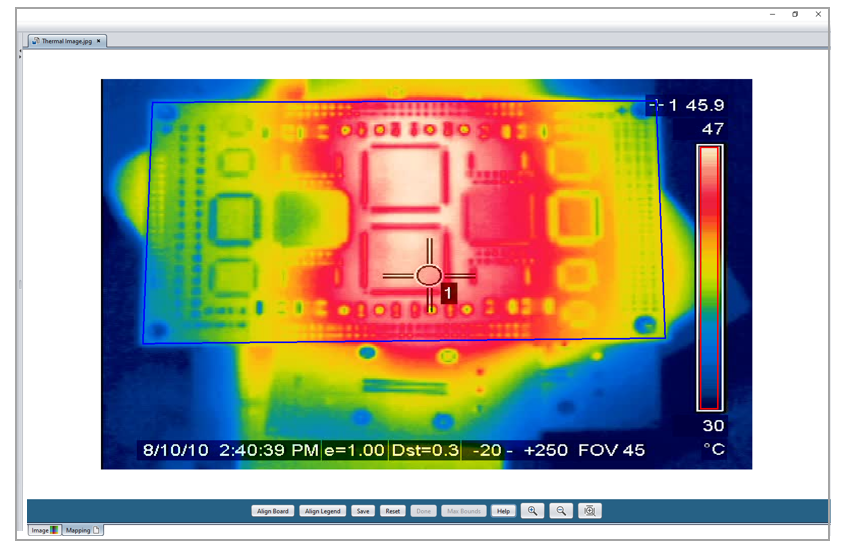
When the alignments are saved, Sherlock gives you the option to view an overlay of the thermal image and the board within the Layer Viewer, as shown above. The image shows us, at the maximum temperature of the cycle, the Mount Points are at 65°C as per the settings, and the maximum temperature in the contour is 80°C represented by the reddish white in the image.
During the Thermal Mech analysis, at the maximum temperature step, Sherlock applies the temperature distribution (from the image) to the exposed faces of the PCB, to the parts, and to any potting regions. All the other nodes will be solved for during thermal analysis. To obtain strain results, Sherlock follows the thermal analysis with a static structural analysis.
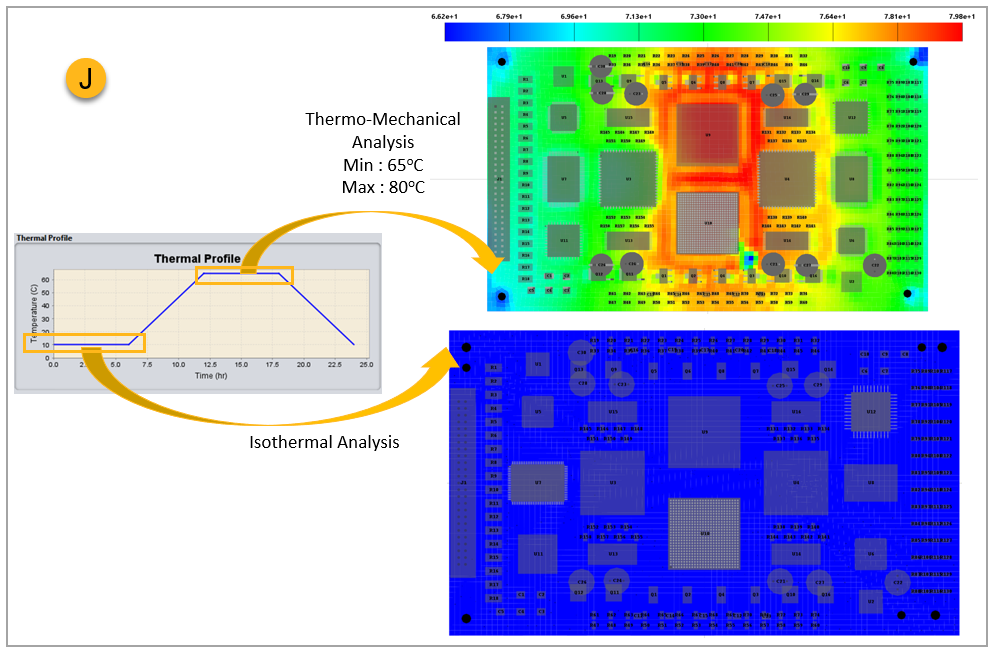
In the example below (J), the Thermal Map (Image) is associated with the maximum step only of the Thermal Event (Environment 1-Temp Cycle). The minimum step is not associated with any image or CSV file, so Sherlock treats this step as an isothermal loading condition.
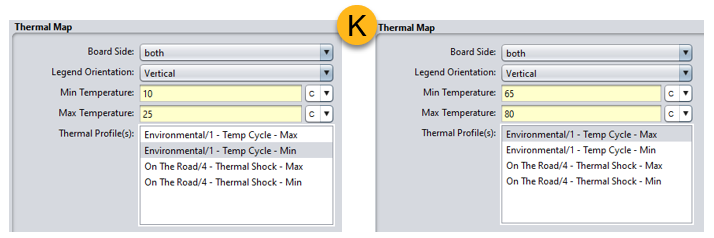
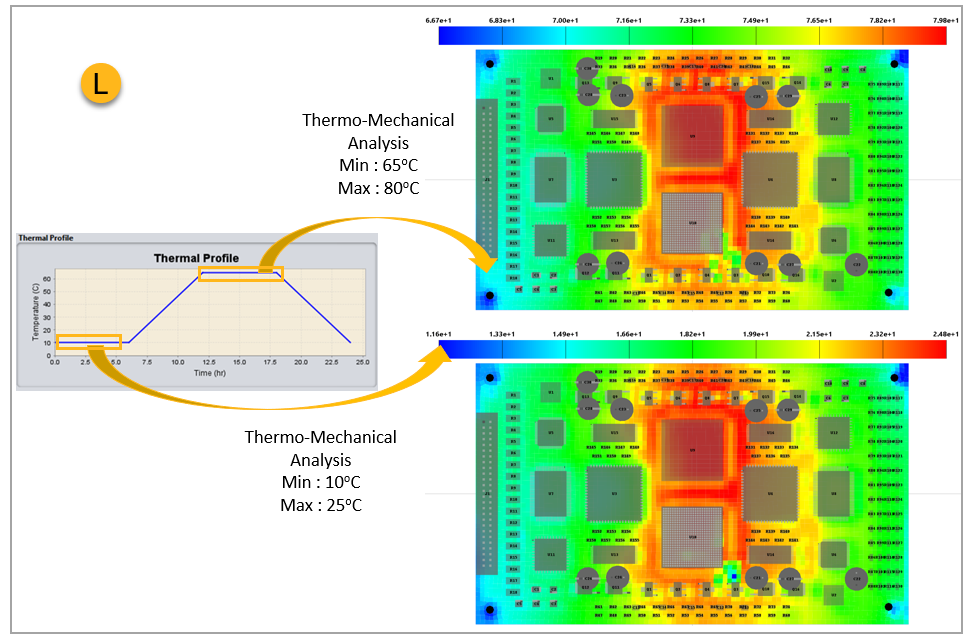
Sherlock also allows you to assign separate images for the minimum and the maximum step of a Thermal Event as shown (K, below). The temperature distribution for the two steps based on the maps is also shown (L) for reference.
For any given Thermal Event, Sherlock runs a static structural analysis without conduction using the Ansys solver for all the analyses, assuming isothermal temperature rise. For an analysis that involves conduction, Sherlock runs a thermal analysis followed by a static structural analysis using results from the previous thermal run.
When one of the steps of a Thermal Event (the minimum or maximum temperature) is associated with a Thermal Map (CSV/Images) while the other step is not, Sherlock will carry out a static structural analysis (isothermal rise) for the step without the Thermal Map and carries out a thermo-mechanical analysis for the step with the Thermal Map. The table below shows the different combinations possible in Sherlock.
| Thermal Event | Thermal Condition | Analysis | |
| Case 1 | Both Steps |
No Part Temp Rise No Thermal Map | Static Structural |
| Case 2 | Both Steps | Part Temp Rise | Thermal + Structural |
| Case 3 |
Step 1 – Min Step 2 – Max |
No Thermal Map Thermal Map |
Static Structural Thermal + Structural |
| Case 4 |
Step 1 – Min Step 2 – Max |
Thermal Map Thermal Map |
Thermal + Structural Thermal + Structural |
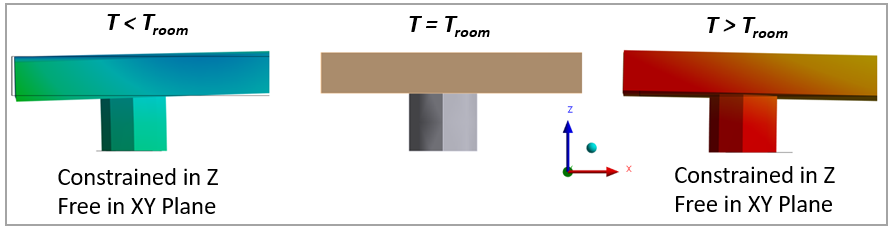
For all the analyses in Thermal Mech, Sherlock allows thermal displacements at the mount points based on the chassis material. Users should understand that the Mount Points are not fixed but are provided a displacement boundary condition during structural analysis based on the temperature and the CTE of the chassis material. If the mount points are modelled as Mount Holes, Sherlock uses the average CTE of chassis and the board material. This is to ensure accurate in-plane expansion of the chassis material on the board. The graphical representation of thermal displacements is shown below. At room temperature/reference temperature, the mount point remains undeformed. At different temperatures, the nodes of the mount points are displaced with respect to the center of the mount points based on the CTE of chassis.
Can two Images/CSV be associated to a single Thermal Event ?
A step (minimum or maximum temperature) of a given Thermal Event cannot carry more than one thermal image. When Image-A is associated to a Thermal Event-Max step, if Image-B is associated to the same step, Image-B will override Image-A. The analysis will be run using Image-B.
When does Part Temp Rise takes precedence?
Sherlock uses Part Temp Rise for running Thermal Mech, only when Use Part Temp Rise is set to YES. If you want no effect from Part Temp Rise during a Thermal Mech analysis, you must set it to NO.
Can one step of the Thermal Event be associated to a Thermal Map (Image) and other step be associated to a Thermal Map (CSV)?
Yes.
Does potting get temperature loads during Part Temp Rise or Thermal Map (CSV)?
No, potting geometry does not get temperature loads as boundary conditions whether from Part Temp Rise or Thermal Map (CSV). Temperature boundary conditions are applied only to the Parts. However, when running Thermal-Mech using Thermal Map (Images), Sherlock does apply temperature loading condition to the potting geometry.
In the Thermal Mech Properties dialog, when you choose Imported as the Data Source, the interface changes as shown below. Use this interface to import thermal mech analysis results (.rst) from Ansys Workbench to Sherlock.
Tip: For detailed, step-by-step instructions for importing results from Ansys Workbench, see the following section: FEA- Ansys Workbench Integration.
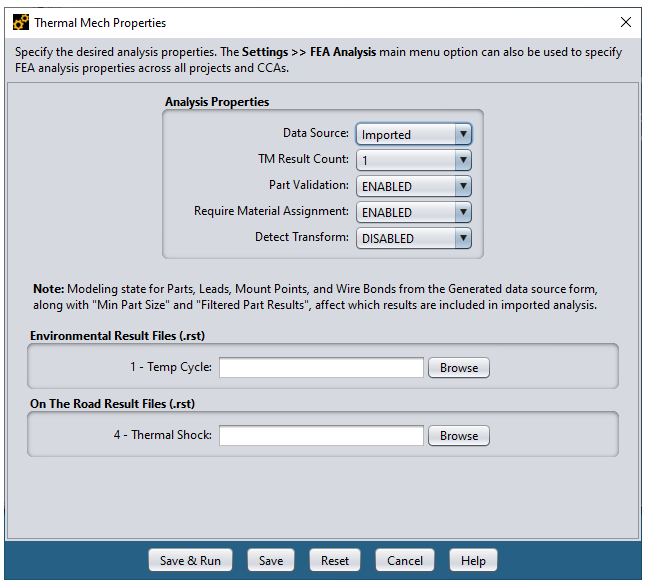
When the Detect Transform is ENABLED, Sherlock will attempt to detect any Transforms applied to the imported model and make adjustments if required. This ensures the imported model matches Sherlock's original model. Select MANUAL to enter Transform properties manually. If a Transform exists and is not detected, Sherlock will not be able to provide component results. When running the Detect Transform feature, Sherlock uses multiple threads by default. To learn more about this feature and how to adjust it, see Transform Detection Threading under FEA Analysis Settings.
If any of the file entries are blank, then Sherlock will assume that no analysis was performed for those events.
When the Save & Run button is pressed, Sherlock will import both the model and the results to determine the reliability results.
Note: When importing data, it is your responsibility to assign the proper results file to each Event. Sherlock has no other way of determining the association.
Note: If lead results are not generated after importing results which contain leads, enable Lead Modeling on the Generated Data Source form and perform the imported analysis again
Once the analysis is complete, Sherlock offers several ways to view the results. While there is a complete guide to navigating analysis results in Viewing and Managing Analysis Results, the section below highlights features relevant to Thermal Mech. Similar to other modules, Sherlock presents the results in tabular form as well as in graphical form which visualizes board and the elemental strains. Irrespective of the type of thermo-mechanical analysis, once the analysis is complete, you can access results from:
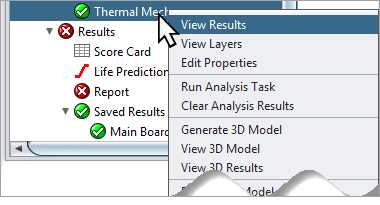
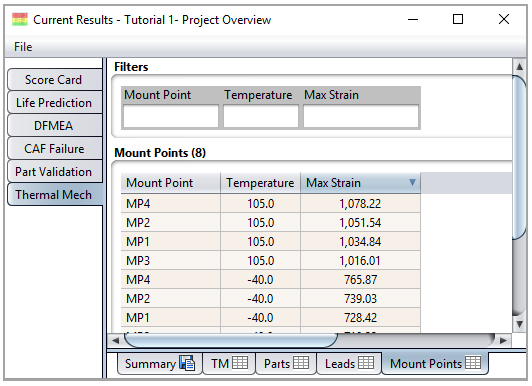
When a Thermal Mech analysis is performed, Sherlock generates tabular results for each part, modeled lead, mount point, and wire bond. To access the Current Results Table, right-click Thermal Mech in the Project Tree and select View Results in the context menu.
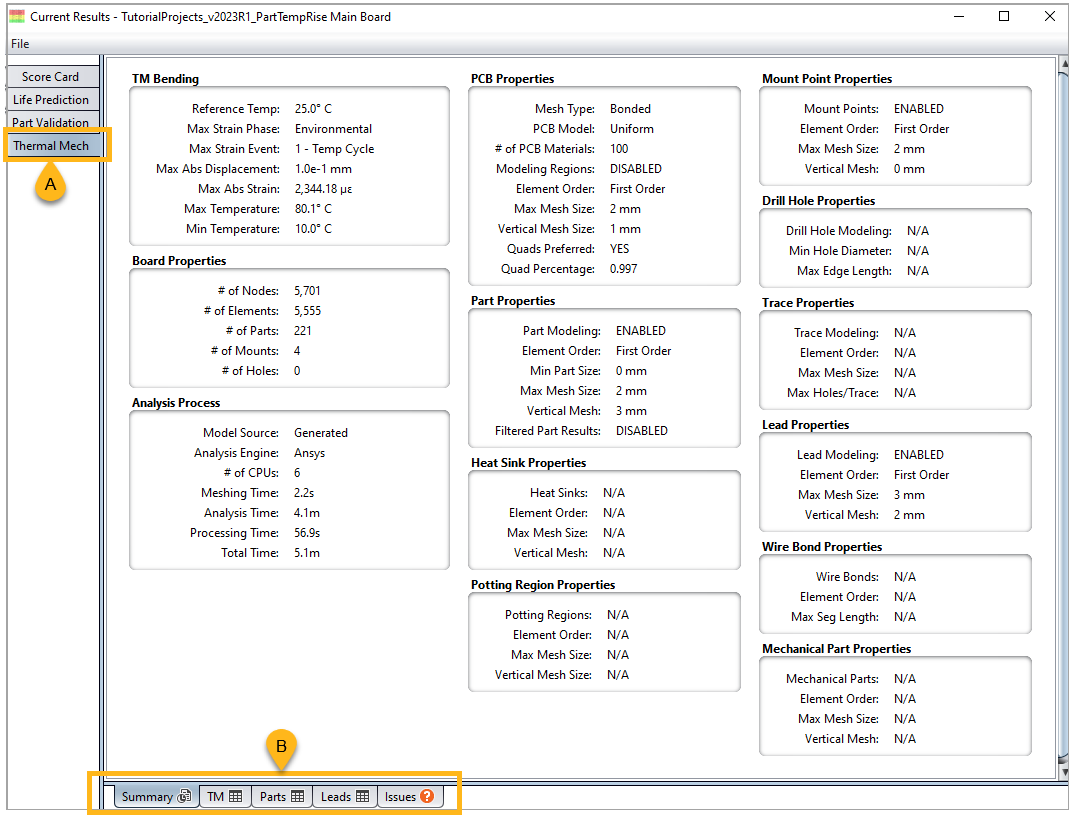
The View Results option opens the Current Results window with the Thermal Mech tab selected (A, in the image below). Use the bottom row of tabs (B) to access results on different aspects of the analysis: Summary, TM (Thermal Mech), Parts, and Leads. In certain conditions, other tabs (such as an Error or Issues tab) might appear.
Tip: Sherlock alerts you to errors or issues encountered during the analysis: An error icon or an issues icon will appear in the Project Tree next to Thermal Mech:
 Thermal Mech - Issue: The analysis ran to completion
but Sherlock identified issues you should investigate.
Thermal Mech - Issue: The analysis ran to completion
but Sherlock identified issues you should investigate. |
 Thermal Mech - Error: Analysis did not run to
completion due to errors.
Thermal Mech - Error: Analysis did not run to
completion due to errors. |
To get more information, click the Issues or
Errors tab in the Current Results window.
The example below shows the results of an analysis where Sherlock identified issues that
should be investigated (note the Issues tab at the
bottom).
Current Results Tabs for Thermal Mech
Summary: The Summary tab provides essential information about the analysis such as the reference temperature, maximum board displacement and strain, the Phase and Event at which the maximum delta strain took place along with the maximum and minimum temperatures the board experienced. In a sense, the information provides displacement and strain from the worst-case Event out of all the Events used during the analysis.
If the analysis used Part Temp Rise or Thermal Mapping, the Max and Min Temperature will not be the maximum and minimum temperatures from the Event—but rather, the maximum and minimum temperatures the board experienced during the analysis.
Sherlock also provides pre-processing information for the analysis under Board Properties, PCB Properties, Part Properties, and so on. Finally, information regarding solve time is also listed under Analysis Process.
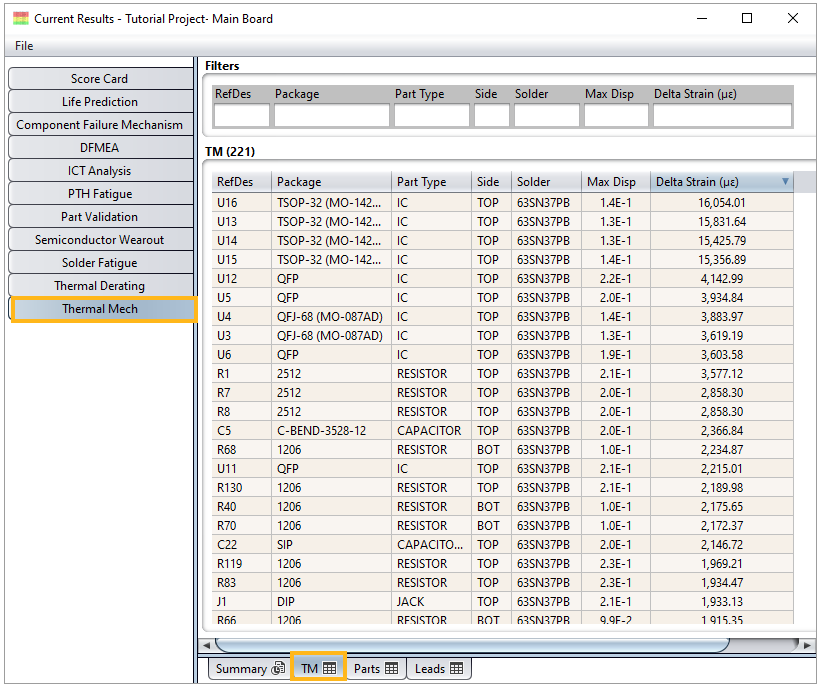
TM (Thermal Mech): The TM tab, as shown below, contains the main table which displays the delta strain for each part analyzed during the analysis. Strain values are in units of microstrain (με).
Tip: Results tables in Sherlock are customizable. To add, remove, or reorder columns, right-click any cell and select Customize. The customization interface is identical to the one for customizing Parts tables.
The TM table provides the following information:
RefDes: The reference designator of the part.
Tip: Why aren't all the parts appearing on the Results Table? It's important to remember, all parts modeled as finite element models will appear in the results. Non-modeled parts appear only if you request it when configuring the analysis. As explained in FEA Model Properties, if you wish non-modelled parts to appear in the results, set Filtered Part Results to ENABLED as shown below. This setting is found in the Thermal Mech Properties dialog.

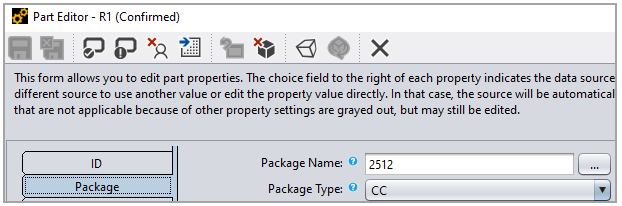
Package: The column provides the package name of the part as specified by the Package Name property in the Part Editor.
Part Type: The column provides the package/part type as specified by the Package Name and Package Type properties in the Part Editor, as shown below.
Side: This column indicates which side of the board the part is located. Any part that is not leaded uses board strain for delta strain calculations. If the part is located on the top side (TOP) of the board, Sherlock uses board strain from the top side of the PCB. If the part is located on the bottom (BOT), delta strain is based on surface strain from the bottom surface of the board.
Solder: The column shows the solder material specified for the part. By default, all parts have their Solder Material property set to DEFAULT. This means Sherlock will use the circuit card's default solder type. You can change the Solder Material for an individual part by using the Solder tab in Part Editor.
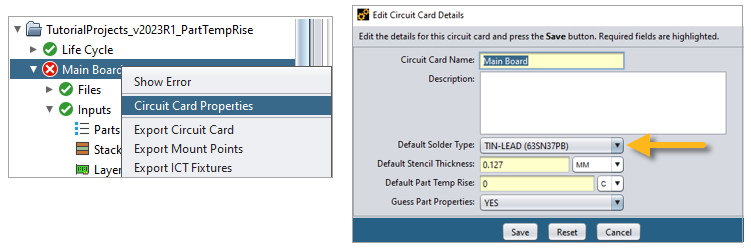
To determine or to set the Default Solder Type for the circuit card, right-click the circuit card in the Project Tree and select Circuit Card Properties as shown below.
Max Disp: The column gives the maximum board displacement (in mm) at the footprint of the part. It is important to understand that the maximum displacement happened during the Event specified under the Delta Strain Event column. If the part is leaded, the displacement provided in the column is for the footprint of the part which includes the leads.
Delta Strain (με): This column provides maximum delta strain for the part among the all the Events included in the analysis. If the component is leaded, the column gives the delta strain for the leads. If the component is not leaded, the delta strain is calculated from the board surface strain.
Strain Source: This column gives the source of delta strain calculation. If the component is leaded, the column will read Lead Strain, if the component is not leaded, the strain will be from PCB Strain.
Delta Strain Event: This column indicates the Event during which the results for the part were calculated. Remember, the Event which caused maximum delta strain for one part may not be the same Event for another part.
Material: This column shows the material of the part. This comes from the part's Material property which you can view or modify in the Part Editor.
PCB Element ID: This column displays the ID (from the finite element model of the PCB) of the element that cause the maximum surface strain for the part.
Weight: This column gives the weight of the Part. This comes from the part's Weight property which you can view or modify in the Part Editor.
Parts Tab: The table in the Parts tab lists three strains for all the parts on the board: 1) PCB Strain, 2) Part Strain, and (3) Lead Strain. If the part is not leaded, the Lead Strain column will be empty.
For a Thermal Mech analysis, each part will have two entries: one at the minimum temperature of the Event causing maximum delta strain and the second one at the maximum temperature of the same Event.
Tip: Remember, results tables in Sherlock are customizable. To add, remove, or reorder columns, right-click any cell and select Customize. The customization interface is identical to the one for customizing Parts tables.
Temperature: This column provides the temperature step name at which the part strain values were calculated. For Events, this will be consistent with the Event min and max temperatures. If Custom Temperature points were used, the step name will be consistent with what you entered in Custom Uniform Temps.
PCB Strain: This column provides the PCB surface strain for the part as maximum elemental surface equivalent strain at the component’s footprint for the event causing maximum delta strain.
Part Strain: This column displays the part strain as the maximum equivalent element strain for the Event causing maximum delta strain.
Lead Strain: This column provides the maximum lead strain for the part as maximum equivalent element strain for the event causing maximum delta strain.
Lead Element ID: This column provides the element ID from the FE model corresponding to the Lead Strain column.
Lead ID: This column provides the lead ID number for the lead strain in Lead Strain column.
PCB Element ID: This column provides the element ID from the FE model corresponding to the strain value in the PCB Strain column.
Part Element ID: This column provides the element ID from the FE model corresponding to the strain value in Part Strain column.
Leads Tab: This table lists three strains for a given lead, namely, PCB Strain, Part Strain, and Max Lead Strain. If there are no leads for any component on the board, the Leads tab will not be available. For Thermal Mech, each lead has two entries, one at the minimum temperature of the Event causing maximum delta strain and the second one at the maximum temperature of the same Event.
RefDes: This column provides the reference designator of the parts that have leads modelled. Parts with leads not modelled as a finite element model, are listed in the Results Table.
Lead ID: This column provides the lead ID number.
Temperature: This column provides the step name at which the part strain values are calculated. This will be consistent with the Event min and max temperatures. If Custom Temperature points were used, the step name will be consistent with what you entered in Custom Uniform Temps.
Max PCB Strain: This column will provide maximum equivalent strain of the lead elements of the Lead ID which are attached to the PCB.
Max Part Strain: This column will provide maximum equivalent strain among the lead elements attached to the part.
Max Lead Strain: This column displays the maximum equivalent strain across the given Lead ID.
Delta Strain Event: The column displays the Event causing the maximum delta strain. This is also the Event where Max PCB strain, Max Part Strain, and Max Lead Strain are computed.
Lead Element ID: This column provides the element ID from the FE model corresponding to the lead identified in the Max Lead Strain column.
Lead Part Element ID: This column provides the element ID from the FE lead model corresponding to the Max Part Strain column.
Lead PCB Element ID: This column provides the element ID from the FE PCB model corresponding to the Max PCB Strain column.
Other Tabs: You will find additional tabs in the Current Results Table for further exploration. Which tabs appear depends on the unique features of your board and whether you chose to model them for the analysis. In the example below, there is a Mount Points tab because four mount points were added to the board and Mount Point Modeling was ENABLED in the Thermal Mech Properties dialog.
As shown below, you can right-click any row to view a part's properties or to export the table. Double-clicking a row brings up the Part Properties window for that part.
As mentioned above if you selected multiple Events for the Thermal Mech analysis (see Thermal Events tab), the results displayed for a given part are based on the Event which caused the largest delta strain. In fact, the table includes a column which displays the Event which caused the reported delta strain (see the last column in the table below).
Tip: If the Delta Strain Event column does not appear in the table, remember, results tables in Sherlock are customizable. To add, remove, or reorder columns, right-click any cell and select Customize. The customization interface is identical to the one for customizing Parts tables.

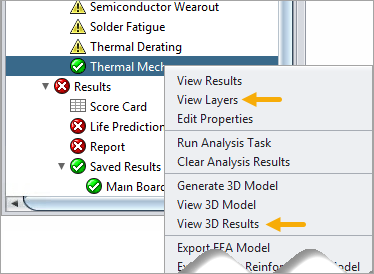
Sherlock provides graphical representations of the results which you can access using the 2D Layer Viewer and the 3D Viewer. To open the viewers, right-click Thermal Mech in the Project Tree. In the context menu, select View Layers or View 3D Results. The results provided in the 2D Layer Viewer are only for the PCB and not for the parts on the board. Use the Sherlock 3D Viewer for viewing parts and leads. For a complete guide to using the viewers, refer to Viewing and Managing Analysis Results.
Layer Viewer
The Layer Viewer in Sherlock provides the ability to plot Displacement, Stress and Strain on the top and bottom surfaces of the PCB at both the minimum and maximum temperature of a given event. It should be noted that the results in the Layer Viewer are associated with the PCB and to get information about Parts and Leads, the User should explore Sherlock 3D Viewer and/or Results Table. The displacement plots are displayed in mm, stress and strain on the other hand are displayed in MPa and micro-strain (με). For Thermal Mech, when the analysis includes conduction (Part Temp Rise or Thermal Map), temperature distribution on the board can be plotted as well.
The naming convention used to represent results in layer viewer is ‘TM {PlotName} @ {StepName} – {EventName}. Some examples are shown below :
| Plot Name | Plot | Step | Event Name |
| TM Disp @ 10.0°C – 1 – Temp Cycle | Displacement | 10.0°C | 1-Temp Cycle |
| TM Strain Top @ 65.0°C – 1 Temp Cycle | Strain Top | 65.0°C | 1-Temp Cycle |
In the case of multiple Thermal Events, the Layer Viewer will display results for the Event(s) that caused maximum displacement. How many Events are displayed is limited by what you entered for the TM Result Count (as illustrated in the image below). Also, to avoid cluttering the display, Sherlock displays a maximum of four Thermal Events in the Layer Viewer
Because of the upper limit of four Thermal Events in the Layer Viewer, if there is a part that has a maximum strain caused by an Event which is not in the top four, the corresponding part’s strain cannot be viewed in Layer Viewer. This is only a plotting limitation. The results tables still account for all Thermal Events.
3D Result Viewer
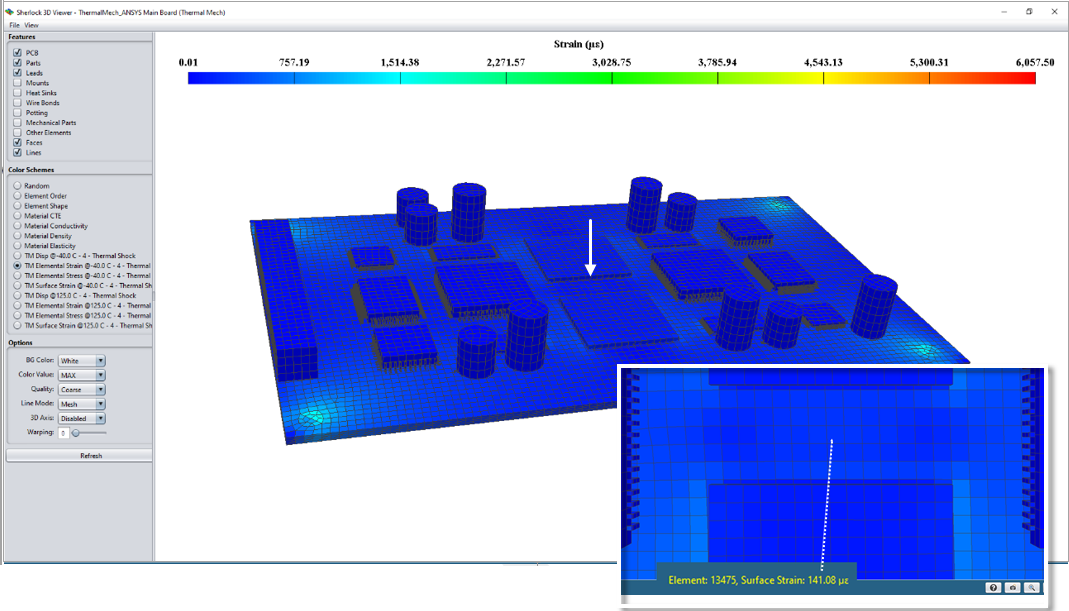
You can view elemental stress and strain in using Sherlock's 3D Viewer. Sherlock also provides options to view displacement and surface strains in the 3D Viewer to compare the contour with that of the Layer Viewer. The inset below illustrates how the 3D Viewer allows you to view surface strain by simply hovering the mouse over a specific element. (See Viewing 3D Results for details.)
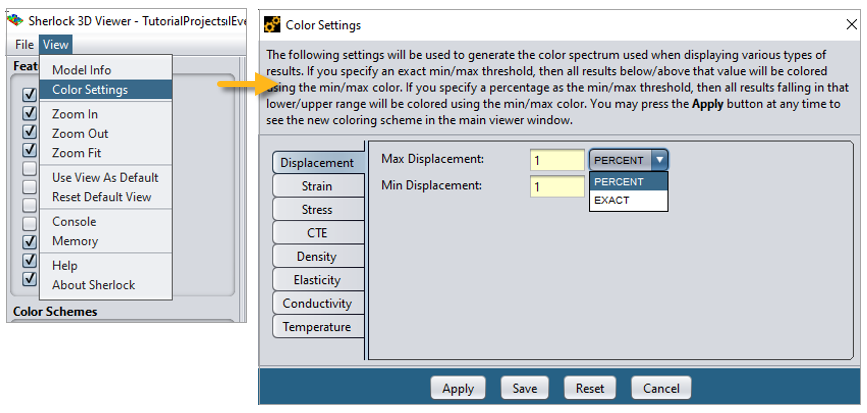
Note: In the 3D Viewer, when viewing any of the color schemes related to material properties (Material CTE, Material Conductivity, Material Density, and Material Elasticity), the values represented are for the material at reference temperature only.
In the 3D Viewer, you can adjust the min and max of the legend, and you can modify the plot based on custom limits. To do this, click View > Color Settings to open the Color Settings dialog. You can set limits for the parameters as a PERCENT or as an EXACT value.