


A history plot shows the change in a specified variable over time at specified points in the model. Time is plotted on the x axis and the variable value is plotted on the y axis. By including a number of points in a single plot, you can compare various locations in the model with respect to the value of a specified variable as a function of time.
You can examine how a variable changes over time at selected
points in the model using the History plot panel
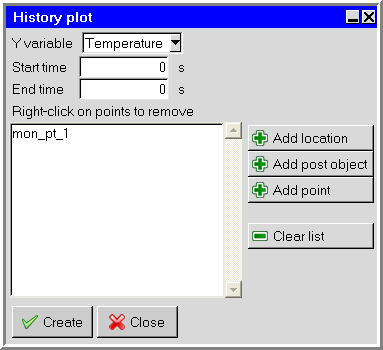
(Figure 26.15: The History plot Panel).
To open this panel, select History plot in the Post menu or click the  button in the Postprocessing toolbar.
Post  History plot
To create a history plot, follow the steps below.
Select the Variable to be plotted on the vertical axis. Temperature is selected by default in the Variable list. To change the variable to be displayed, select a new variable from the Variable drop-down list. See Variables for Postprocessing and Reporting for information on variables.
Specify the interval of the transient simulation to be examined by entering values for the Start time and the End time. This interval will be plotted on the horizontal axis.
There are three options to specify the location of the point of interest for the history plot:
Add location allows you to specify the coordinates of a point. Enter the X, Y, and Z coordinates or select From screen to select the points on the screen with the left button. Click the Done button. The point will appear in the Right-click points to remove list.
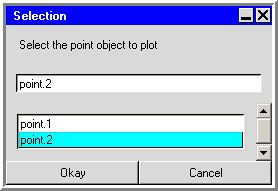
Add post object allows you to select an existing point object from the Selection panel (Figure 26.16: The Selection Panel).
In the Selection panel, select the point in the list and click Okay. The point will appear in the Right-click points to remove list in the History plot panel. See Displaying Results at a Point for details on creating a point object.
Add point allows you to select an existing point from the point drop-down list or create a new point, as described below.
Click Create to display the XY time history plot of the selected variable at the point(s) specified. Click Close to close the History plot panel without creating a history plot.
Points
Ansys Icepak allows you to create points that can be used to specify the location at which Ansys Icepak should create a history plot. Points can also be used to specify the location at which Ansys Icepak should create a point report (see Point Reports), define the location of a point object for postprocessing (see Displaying Results at a Point), and define the location of a point monitor (see Monitoring the Solution).
To select a point, click the Add point button in the History plot panel (Figure 26.15: The History plot Panel) and select a point from the Add point drop-down list. The point drop-down list can be used to create a new point or edit an existing point.
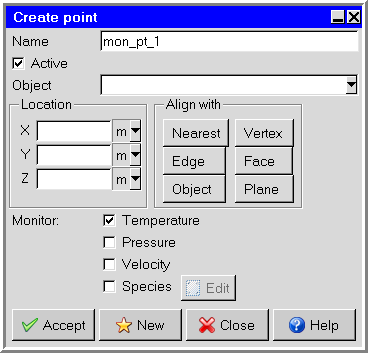
To create a new point, click the Add point button in the History plot panel and select New point from the point drop-down list. This will open the Create point panel (Figure 26.17: The Create point Panel). Enter a name in the Name field and then specify the location of the point in the model. There are two ways to do this:
Enter the X, Y, and Z coordinates.
Click a surface to align with using the (Nearest, Edge, Object, Vertex, Face, or Plane button) and click a location in the graphics window with your left mouse button to select the location of the point.
Specify whether Temperature, Pressure, Velocity or Species will be monitored at the point. Click Accept when you have finished creating the point. To create another point, click New and click Close to close the Create point panel.
To edit an existing point, select the point in the Model manager window and right-click to display the object's context menu. Select Edit. Ansys Icepak will open the Modify point panel (Figure 36.5: The Modify point Panel). You can edit the name in the Name text entry field and then edit the location of the point in one of two ways:
Enter the X, Y, and Z coordinates.
Click a surface to align with using the (Nearest , Edge, Object, Vertex, Face or Plane button) and click a location in the graphics window with your left mouse button to select the location of the point.
Click Done when you have finished editing the point, and Ansys Icepak will close the Modify point panel.
If there are points in the History plot panel (Figure 26.15: The History plot Panel) that you no longer need, you can easily delete them. To remove specified points, right-click the individual point names in the Right-click points to remove list and click Remove points. The point will be permanently removed from the point drop-down list in the History plot panel.
Activating and Deactivating Points
By default, all points that you create will be available in your current Ansys Icepak model. You can temporarily remove a point from all of the point drop-down lists by turning off the Active option for the point in the Create point panel (Figure 26.17: The Create point Panel). You can repeat this for each point that you want to temporarily remove from your model. When a point is deactivated, it is simply removed from the point drop-down lists, not deleted from Ansys Icepak. Since it still exists, you can easily add it to the point drop-down lists again by turning the Active option back on.
Note that, if you deactivate a point that is currently being used in your Ansys Icepak model, Ansys Icepak will still use the point. Deactivating a point only removes it from the point drop-down lists so that it cannot be selected.